
US stock markets managed to string two days in the greens amidst a market selloff, as investors seized the opportunity to bargain hunt discounted equities, since the market bets, for a dovish pivot from the Fed, increase. In this report we aim to present the recent fundamental and economic news releases that impacted the US stock markets, look ahead at the upcoming events that could affect their performance and conclude with a technical analysis.
Wishful equity traders wager for dovish pivot
The sharp recovery of all three main US indices from oversold conditions was partly due to the softer than expected ISM manufacturing PMI figure released on Monday, which pointed to a slowdown in factory activity within the US and raised hopes among market participants, that the Fed will slow the pace of its upcoming interest rate hikes. The surprise slowdown of manufacturing output showed that activity declined to its lowest since May 2020, indicating that tightening market conditions could take a toll on demand within the US. Also, yesterday’s release of the JOLTs report showcased a bigger than expected decline in the US job openings, signalling a possible loosening of the tightness of the labour market and renewed the hopes for a dovish pivot, with investors opting for a risk on approach and indulging in a shopping spree of discounted equities. Another factor contributing towards the best performing two-day rally since 2020, was the further easing of the greenback from its recent 20-year highs, given the discouraging results, and the extended declines in the benchmark US 10-year treasury yield, which fell below 3.6%, easing from its 12-year high level reflecting the market’s sentiment. Today, we note the release of the ADP national employment data and the ISM non-manufacturing PMI both for the month of September, however, the event that could serve as the next catalyst for the US stock markets, is the employment report for September which is expected to hit the markets this Friday and will be of particular interest for the Fed, since it falls under the scope of its dual mandate commitments. Nonetheless in our view, we expect that any rally in US stock markets may be short lived, as the negative repercussions of the Fed’s tightening cycle could be reflected on the earnings reports which are to start being released next week, despite the premature speculations from the market that the Fed had reached peak hawkishness.
Twitter fiasco continues
Yesterday, Twitter’s shares surged 22%, after headlines surfaced that Tesla’s CEO Elon Musk may ultimately proceed with his plans to buy out the social media company, seeking to complete his original deal at the previously agreed price of $54.20 per share. Today it was reported that Musk indeed sent a letter to Twitter proposing the completion of the $44 billion leveraged buyout transaction confirming the rumors. Noteworthy, was also a tweet from Musk himself stating that “Buying Twitter is an accelerant to creating X, the everything app”, referring to his previously considered idea for creating an alternative to Twitter, resembling some key features of WeChat. Furthermore, the market will be looking closely for any updates in regards to the financing details for the deal and as of now, Musk would need to sell a big chunk of his personal holdings to complete the transaction. Looking ahead we note the Delaware Chancery Court trial which is to take place on 17th of October, where the two parties are set to meet and solve their difference about the issue.
التحليل الفني
US 30 Cash H4 Chart
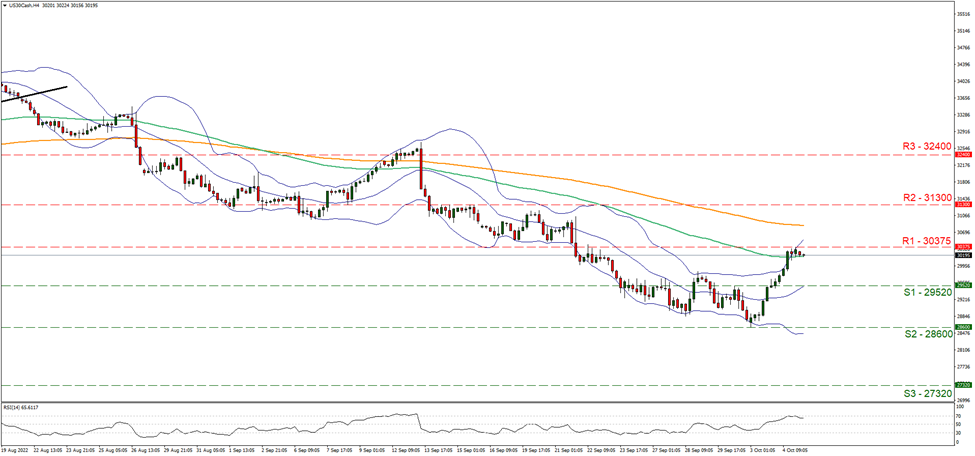
Support: 29520 (S1), 28600 (S2), 27320 (S3)
Resistance: 30375 (R1), 31300 (R2), 32400 (R3)
Looking at the 4-hour chart of Dow Jones we observe its rise yesterday edging closer to the 30375 (R1) resistance level. Overall, there seems to be still some bullish sentiment in the market that may allow the index to advance further, yet there are some signs of stabilization as well. We hold a bullish bias for the continuation of the index’s upward short-term movement and supporting our case is the RSI indicator below the 4-hour chart that registers a value of 67 showcasing bullish tendencies surrounding the index. We also note the breach of the upper bound of the Bollinger band that could signal the price has gotten ahead of itself and a correction may be due. Should the bulls actually maintain control over the index, we may see it breaking the 30375 (R1) resistance line and aim for the 31300 (R2) level. On the flip side, should the bears take over, we may see the pair reversing course, breaking the 29520 (S1) support line on its journey southwards.
If you have any general queries or comments relating to this article please send an email directly to our Research team at research_team@ironfx.com
إخلاء المسؤولية:
لا تُعد هذه المعلومات نصيحة استثمارية أو توصية بالاستثمار، وإنما تُعد تواصلاً تسويقيًا. لا تتحمل IronFX أي مسؤولية عن أي بيانات أو معلومات مقدمة من أطراف ثالثة تم الإشارة إليها أو الارتباط بها في هذا التواصل.