
The bearish tendencies for the common currency seem to continue, as fundamentals and monetary policy outlook still weigh on the EUR. We still note though the comments made by ECB President Lagarde yesterday that the bank has to remain cautious regarding its rate-cutting path. The comment sounded less dovish if compared to the market’s expectations yet failed to provide any support for the single currency yesterday. ECB’s chief strategist Philip Lane stated that disinflation in the Euro area is well on track, practically reinforcing the perception that the bank may have more leeway in cutting rates. Please note that Mr. Lane is scheduled to speak again today and could sway EUR traders’ opinion. Yet today we intend to focus on the macroeconomic outlook of the Euro Zone, which is tantalized by the troubles faced by growth. Specifically, the release of the preliminary PMI figures for October, are expected to show a slight improvement and if actually so, could provide some support for the EUR as they could imply that the contraction of economic activity for the area may be bottoming out, yet we maintain our doubts for the actual figures. Should the indicators show a deepening contraction of economic activity for the current month, especially in Germany’s manufacturing sector, we may see the release weighing on the EUR.
EUR/USD edged lower yesterday testing the 1.0775 (S1) support line. We tend to maintain our bearish outlook as long as the downward trendline guiding the pair since the 30th of September, remains intact. Please note that the RSI indicator remains continues to run along the reading of 30, highlighting the continuance of the strong bearish sentiment of the market for the pair, yet at the same time may imply that the pair is at oversold levels and may correct higher. Yet the price action seems to have still some distance from the lower Bollinger band, implying that there is still some room for the bears to advance. Should the bears maintain control over EUR/USD, we may see the pair breaking the 1.0775 (S1) support line and start aiming for the 1.0670 (S2) level. Yet today’s correction higher, seems to be threatening the prementioned downward trendline and should the price action be able to break it clearly we may see the bulls taking over and for a bullish outlook we would require the pair to aim if not break the 1.0890 (S1) resistance line.
On the commodities front, oil prices rose slightly during today’s Asian session, despite data showing that a slack was building up in the US oil market over the past week. On an international level, the escalation of the conflict in the Middle East with Israel attacking, besides Beirut, also Damascus, capital of Syria, tends to intensify the market worries for the conflict evolving in a full-blown-out regional war, limiting the supply of oil and thus having a bullish effect on oil prices.
On a technical level, WTI prices edged lower yesterday after hitting a ceiling on the 71.60 (R1) resistance line, yet also seem to be taking a swing at the specific resistance line once again during today’s Asian session. The RSI indicator remains at the reading of 50 implying a rather indecisive market regarding the direction for the commodity’s price. For a bullish outlook we would require WTI’s price to break the 71.60 (R1) resistance line clearly and aim for the 75.50 (R2) resistance base. Should the bears take over, we may see WTI’s price correcting lower and aiming if not testing the 68.00 (S1) support level.
Other highlights for the day:
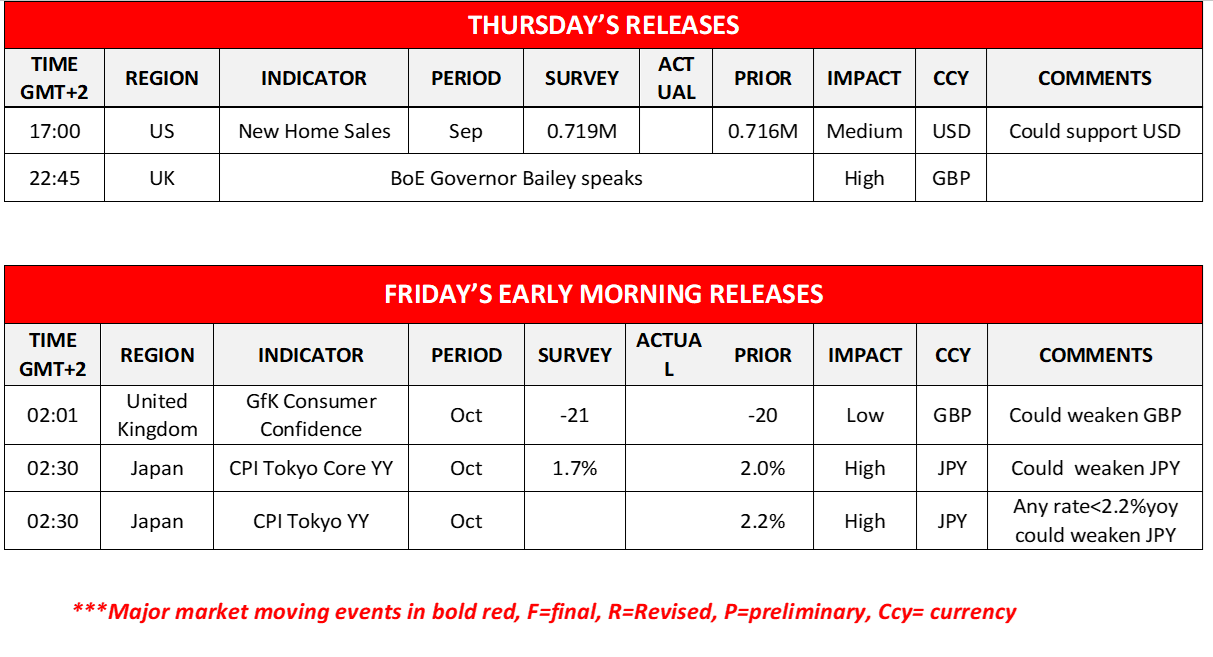
Today we also get the preliminary PMI figures of the UK and the US for October, France’s October business climate indicator, UK’s CBI trends indicator for October and Business optimism for Q4 and from the US the weekly initial Jobless claims figure and the New Home sales figure for September. On the monetary front, we note that ECB Chief Economist Lane, BoE MPC member Mann and BoE Governor Bailey are scheduled to speak. During tomorrow’s Asian session, we get UK’s consumer confidence for October, and from Japan Tokyo’s CPI rates for the same month.
EUR/USD Daily Chart

- Support: 1.0775 (S1), 1.0670 (S2), 1.0530 (S3)
- Resistance: 1.0890 (R1), 1.1000 (R2), 1.1100 (R3)
WTI Daily Chart

- Support: 68.00 (S1), 64.70 (S2), 61.65 (S3)
- Resistance: 71.60 (R1), 75.50 (R2), 78.70 (R3)


If you have any general queries or comments relating to this article please send an email directly to our Research team at research_team@ironfx.com
إخلاء المسؤولية:
لا تُعد هذه المعلومات نصيحة استثمارية أو توصية بالاستثمار، وإنما تُعد تواصلاً تسويقيًا. لا تتحمل IronFX أي مسؤولية عن أي بيانات أو معلومات مقدمة من أطراف ثالثة تم الإشارة إليها أو الارتباط بها في هذا التواصل.