
S&P 500 and Nasdaq seem to have renewed their bullish tendencies over the past week, while Dow Jones seems to remain confined in a sideways motion. In this report, we are to discuss the Fed’s stance, upcoming US financial releases, the Meta-EU spat and for a rounder view, finish off the report with a technical analysis of NASDAQ’s daily chart.
The Fed’s intentions
We note that Fed policymakers seem to hesitate to start cutting rates, despite recognizing the need to cut rates before year’s end. It’s characteristic that Fed Chairman Powell yesterday albeit recognizing the progress made on the disinflationary path we also stated that “We need to be more confident before reducing policy rates”. Overall their hesitation seems to contradict market expectations for the bank to proceed with two rate cuts, one in September and one in December. Should we see more Fed policymakers coming forward and supporting the idea of maintaining rates high for longer, we may see the market being forced to reposition itself and thus could provide some downward pressure for US stock markets. Hence we tend to highlight the release of the Fed’s June meeting minutes later today. The document is expected to be scrutinized by market participants and analysts alike, in search of clues regarding the bank’s intentions. Should the document show that Fed policymakers are still hesitant to start cutting rates or are even predisposed to keep rates high for longer we may see US stock markets losing some ground.
US financial releases
On Friday’s early American session, we note the release of June’s US employment report. The Non-Farm Payrolls figure is expected to drop to 190k if compared to May’s 272k, the unemployment rate to remain unchanged at 4.0% and the average earnings growth rate to slow down to 3.9%yy if compared to May’s 4.1%yy. Should the actual rates and figures meet their respective forecasts, the indicators would be aligning towards implying a possible easing of the US employment market which in turn may add more pressure on the Fed to start cutting rates given its dual mandate to keep inflation low and steady yet also at the same time promote maximum employment. In such a case we may see US stock markets getting some support, yet we have to note that the actual rates and figures of the release tend to differ substantially from forecasts hence uncertainty is at high levels. On second note we would also like to mention the release of the ISM non-manufacturing PMI figure for June later today which is to gauge economic activity for the sector.
Meta’s EU accusations
We tend to note the issue arising from EU accusing Meta, for breaching European competition regulations. According to CNN, the company is accused that it’s “Subscription for no ads” allowing European users of Facebook and Instagram to pay up to €12.99 ($14) a month for ad-free versions with the alternative being to accept versions with personalized ads. The EU’s stance seems to be that the two options “force users to consent to the (use) of their personal data and fails to provide them a less personalized but equivalent version of Meta’s social networks”. Should the accusations be confirmed, as they are still at a provisional stage, the company may be fined up to 10% of its worldwide revenue, ie $13.5 billion. Yet the issue is wider than Meta as such as the EU announcement comes a week after the EU Commission accused Apple (AAPL) of breaching the EU Digital Markets Act, by preventing app developers from freely directing consumers to cheaper services. The regulators are also investigating Google parent Alphabet (GOOGL) under the new law. We see the case for the tensions between the EU and big tech companies to intensify and if actually so could weigh somewhat on their share prices, given the size of the European market.
Technical Analysis
US100 Daily Chart
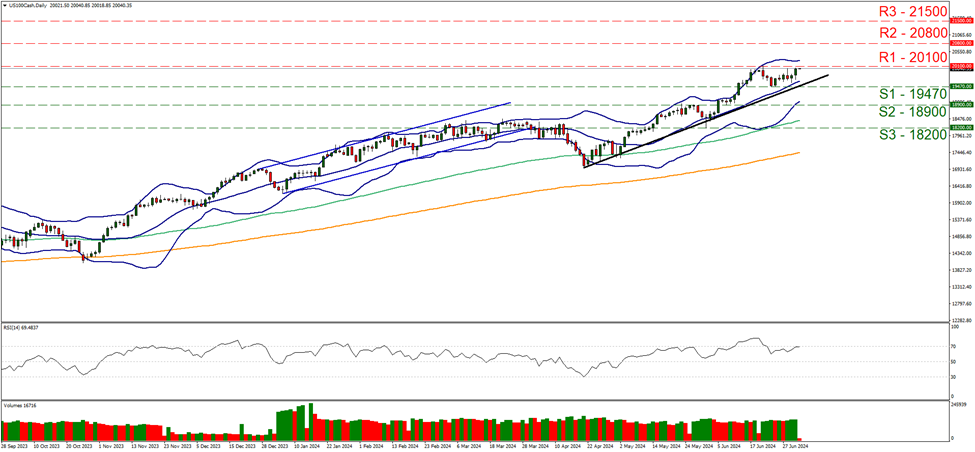
- Support: 19470 (S1), 18900 (S2), 18200 (S3)
- Resistance: 20100 (R1), 20800 (R2), 21500 (R3)
US100 renewed its bullish tendencies over the past week, aiming for the 20100 (R1) resistance line, marking a record high level for the index. We tend to maintain our bullish outlook for the index as long as the upward trendline guiding Nasdaq since the 19th of April remains intact. Furthermore we also note that the 20 moving average (MA, blue line), 100 MA (green line) and the 200 MA (Orange line) are all pointing upwards supporting the bullish outlook for the index. Also the RSI indicator remains close to the reading of 70 implying a strong bullish sentiment among market participants for Nasdaq. On the flip side, the RSI indicator may also be implying that the index’s price action has reached overbought levels and may be ripe for a correction lower. At the same time we also note a relative difficulty on behalf of the index to break the 20100 (R1) resistance line. Should the bulls remain in charge of the index’s direction, we may see it breaking the 20100 (R1) resistance line, moving into unchartered waters and we set as the next possible target for the bulls, the 20800 (R2) resistance level. Should the bears take over, we would require the index to initially break the prementioned upward trendline, signaling the interruption of the upward movement and continue to clearly break the 19470 (S1) support line, taking aim of the 18900 (S2) support level.
If you have any general queries or comments relating to this article please send an email directly to our Research team at research_team@ironfx.com
Disclaimer:
This information is not considered as investment advice or an investment recommendation, but instead a marketing communication. IronFX is not responsible for any data or information provided by third parties referenced, or hyperlinked, in this communication.