
The Fed’s decision is in focus today, as traders and investors closely watch the central bank’s interest rate announcement and forward guidance.
Market participants are assessing how the decision could influence the U.S. dollar, forex pairs, and global equity markets, with expectations shaped by recent inflation trends, employment data, and oil price movements.
Fed’s interest rate decision in focus
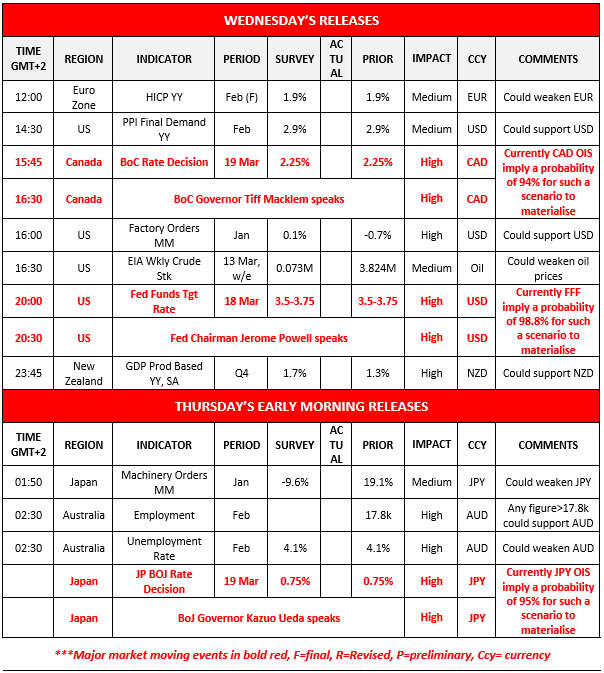
Today we highlight the release of the Fed’s interest rate decision in the late American session.
The bank is widely expected to remain on hold which is also or base scenario, hence we turn our attention towards the bank’s forward guidance which is to be included in the accompanying statement, the new dot plot, the bank’s macroeconomic projections and Fed Chairman Powell’s press conference.
We may see expectations for resilience of inflationary pressures, given also the rise of oil prices, shifting the bank’s tone increasingly towards the hawkish side which could provide support for the USD. On the flip side, the recent looseness of the US employment market tends to advise an easing of the bank’s monetary policy.
BoC also expected to remain on hold
Also in today’s American session, we get from Canada, BoC’s interest rate decision and the bank is expected to keep rates unchanged.
We expect the bank to start adopting a more dovish tone in its forward guidance, as Canada’s CPI rates slowed down, while the employment market seems to be quite loose, which in turn may weigh on the Loonie.
BoJ to keep rates unchanged
In tomorrow’s Asian session, we also note the release from Japan of BoJ’s interest rate decision and the bank is expected to stand pat. We would not be surprised to see the bank in its forward guidance leaning on the hawkish side, yet the market grew relatively accustomed to such a tone.
Nevertheless, such a scenario could still provide some support for the JPY, should the bank’s hawkishness exceed the market’s expectations.
US equities on the rise
US equities were on the rise yesterday and during today’s Asian session, in a signal of the market’s confidence timidly resurfacing. Should we see the risk on approach of the market amplifying we may see US equities rising further.
Also we note that a sufficiently hawkish approach by the Fed could weigh on US stock markets today.
On other news, NVIDIA seems to have got Beijing’s approval for exporting of certain chips in China, which could provide some support for its share price.
Other highlights for today
In today’s American session we get from the US, the PPI rates for February, the factory orders for January and the EIA oil figure and New Zealand’s GDP rates for Q4 25. In tomorrow’s Asian session, we get Australia’s employment data for February.
Charts to keep an eye out
USD/CAD
USD/CAD edged higher in today’s Asian session and seems about to take another swing at the 1.3720 (R1) resistance line.
The RSI indicator is above the reading of 50 implying a bullish market predisposition for the pair, yet for the time being we maintain a bias for sideways motion of the pair.
To adopt a bullish outlook we would require the pair to clearly break the 1.3720 (R1) resistance line and start aiming for the 1.3880 (R2) level.
For a bearish outlook to emerge, which we consider currently as a remote scenario, we would require USD/CAD to break the 1.3550 (S1) support line and start aiming for the 1.3420 (S2) support level.
Dow Jones
Dow Jones (US30CASH) was on the rise yesterday and during today’s Asian session broke the 47150 (S1) resistance line now turned to support.
We note the easing of the bearish market sentiment for the index, and given that hits price action has broken the downward trendline guiding it and 47150 (S1) level, we warn for its bullish tendencies.
Should the upward movement be renewed, we may see the index’s price action actively aiming for the 48350 (R1) resistance level.
Should the bears take over, we may see the index’s price action reversing direction, breaking the 47150 (S1) support line and reaching if not breaching the 45750 (S2) support barrier.
USD/CAD Daily Chart

- Support: 1.3550 (S1), 1.3420 (S2), 1.3285 (S3)
- Resistance: 1.3720 (R1), 1.3880 (R2), 1.4020 (R3
US 30 Cash Daily Chart

- Support: 47150 (S1), 45750 (S2), 44580 (S3)
- Resistance: 48350 (R1), 49600 (R2), 50535 (R3)
Disclaimer:
This information is not considered as investment advice or an investment recommendation, but instead a marketing communication. IronFX is not responsible for any data or information provided by third parties referenced, or hyperlinked, in this communication.


