
US stock markets seem to have moved lower since our last report. In today’s report, we would like to address what fundamentally seems to be driving them, with a small comment for Tesla. Also, the earnings season has begun and we conclude our report with a technical analysis of Nasdaq’s daily chart.
US inflation concerns and the ongoing earnings season
The US retail sales rate for March came in better than expected on Monday. The retail sales rate showcased a resilient consumer retail side of the US economy by exceeding expectations from economists on a month-on-month level. An improvement in retail sales could imply an increase in consumption and thus may add to inflationary pressures in the US economy. Furthermore, the recent financial releases which showcased a resilient US economy, appear to be worrying for Fed policymakers, as Fed Chair Powell during his comments yesterday stated that “the recent data have clearly not given us greater confidence and instead indicate that it’s likely to take longer than expected to achieve that confidence”. The comments may imply that the recent financial releases which appear to imply that inflation appears to be sticky, could lead to the Fed maintaining its restrictive monetary policy for a longer time period. Therefore, with market expectations of the Fed keeping interest rates at their current levels for a longer time period , the dollar appears to have gained which in turn may have weighed on the US Equities markets.
Furthermore, we note that the earnings season has kicked off. Last week we mentioned that the earnings releases could be used as a gauge of the health of the US financial sector. In particular, JPMorgan&Chase (#JPM) despite beating analysts’ expectations on earnings per share and revenue for Q1 2024, saw a reduction in its stock price after announcing an underwhelming outlook for its lending business, per the FT. For next week, we are noting that a number of high profile companies are set to release their earnings reports, such as Boeing (#BA), General Motors (#GM), IBM(#IBM), Microsoft (#MSFT) and Google (#GOOG) amongst others.
Tesla to sack 10% of its global workforce
According to a report by Reuters, Tesla (#TSLA) is laying off more than 10% of its global workforce. The announcement has further aided speculation that Tesla’s growth prospects may be in trouble, following the alleged cancelation of its “inexpensive car project” that was rumored to have been priced at around $25,000. The headcount reduction could be due to a potential reduction in the company’s future growth prospects, and thus appears to have been negatively received by market participants, as the company’s stock price moved lower for the day following’s Reuters report. On another note, Tesla is preparing to ask Investors to vote on the approval of moving Tesla’s state of incorporation from Delaware to Texas and ratifying Elon Musk’s compensation package that was approved in 2018. The second issue appears to be controversial, as the package that gave Musk the right to buy up to 304 million shares at a preset price of $23.34, was struck down in a Delaware court a few months ago. Per the WSJ, the proposal could set off a bitter battle among investors and governance experts. In such a scenario, the impending “battle” could weigh on the company’s stock price up until the vote is held. However, should a more clear picture emerge either in favour of the proposal or against it, the impact of the impending vote on the company’s stock price could be reduced. Please note Tesla (#TSLA) is anticipated to release it’s earnings report for Q1 next week.
تجزیه و تحلیل فنی
#US100 Cash Daily Chart
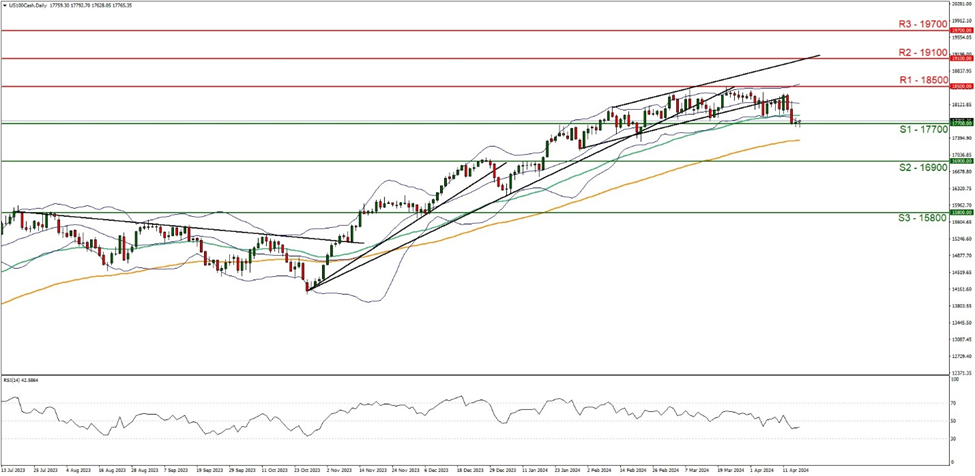
Support: 17700 (S1), 16900 (S2), 15800 (S3)
Resistance: 18500 (R1), 19100 (R2), 19700 (R3)
Nasdaq appears to be on track to end its 4 week in the reds. Nonetheless, we tend to maintain our bias for the sideways motion to continue as long as the price action of the index respects the 17700 (S1) support level and the 18500 (R1) resistance line. Please note that the sideways direction was highlighted by the breaking of the lower boundary of the past upward channel on the 4 of April. Furthermore, the Bollinger bands appear to have smoothened out, implying low market volatility. However, we note that the RSI indicator below our daily chart tends to remain close to the reading of 40, some bearish market tendencies. Hence to switch our current sideways movement bias in favour of a bearish outlook, we would require a clear breaking of the 17700 (S1) support line with the next possible target for the bears being the 16900 (S2) support level. Lastly, should the bulls take control of the index’s direction, we may see Nasdaq’s price action breaking the 18500 (R1) resistance line, which could pave the way for the next potential resistance level at the 19100 (R2) figure.
اگر در مورد این مقاله سوال یا نظر ی کلی دارید، لطفاً ایمیل خود را مستقیماً به تیم تحقیقاتی ما بفرستیدresearch_team@ironfx.com
سلب مسئولیت:
این اطلاعات به عنوان مشاوره سرمایه گذاری یا توصیه سرمایه گذاری در نظر گرفته نمی شود ، بلکه در عوض یک ارتباط بازاریابی است. IronFX هیچ گونه مسئولیتی در قبال داده ها یا اطلاعاتی که توسط اشخاص ثالث در این ارتباطات ارجاع و یا پیوند داده شده اند ندارد.