


Oil prices seem to have moved lower since the start of the week. We are to discuss the easing of the recent situation in Syria, the easing of the US oil market once more and the recent monthly report by OPEC. The report is to be concluded with a technical analysis of WTI’s daily chart.
Syria-Israel in focus
Tensions between Syria and Israel have escalated over the past few daysfollowing the deadly clashes between Druze militias and Sunni Bedouin fighters in the Southern part of Syria.
This Tuesday, Israel intervened on a military level, stating that their intent was to protect the Druze population and to eliminate pro-government forces which were accused of attacking the Druze population in Suweida. The situation further escalated after Israel carried out military airstrikes near the president palace in Damascus.
Following the recent escalation, Syria has announced that it would be withdrawing its troops from the city with Syria’s President stating that they are “not afraid of war” but have opted to place their people “above chaos and destruction”.
In turn the two group’s now have a fragile truce agreement which currently appears to be holding, but with unverified reports of hostilities and actions which may be deemed as inhumane in the area it may not last long.
Overall, should the situation escalate over the weekend and possibly draw in other regional actors and threaten the oil supply chain once again, it could aid oil prices.
However, should diplomacy in this instance prevail we may see a minimal impact on oil prices. In our view, although a truce has been reached, it may not last in part due to the allegations of human rights violations which a new Syrian Government may find difficult overlooking as it seeks to establish further legitimacy amongst it’s own people and on a global stage. Yet in the absence of a wider regional war, oil prices may not be affected significantly.
US oil market continues to ease in part
Making a start with the data on the ground of the US oil market, we note that last Friday, Baker Hughes reported once again a reduction of active oil rigs in the US from 425 to 423.
It’s notable that it’s the 11th weekly drop of the indicator’s reading, potentially signalling once again that demand in the US oil market is easing which in turn may be bearish for oil prices.
Furthermore, on Tuesday API, despite expected to show a drawdown once again, showed a tremendous build up of US oil inventories by 19.1million barrels underscoring the lack in demand for oil from the US oil market.
However, the EIA weekly crude oil inventories figure yesterday showcased a wider drawdown than what was expected at -3.859 million barrels.
In contrast to the API data, the EIA inventories figure showcases that demand exceed supply for the week. Nonetheless, the overall narrative appears to pointing to the easing of the US oil market, which could further weigh on oil prices. Yet, should that narrative appear to change it may provide some support for oil prices.
OPEC’s fails to meet its own output hike plan?
OPEC’s monthly report was released this Tuesday and appears to showcase that “OPEC+ producers pumped 41.559 million barrels per day (bpd) of crude oil in June, up by 349,000 bpd from May, but lower than the 411,000 bpd monthly increase under the alliance’s output hike plan.” Per OILPRICE.
In turn the implications that OPEC has not been increasing it’s oil supply into the market as was discussed, could potentially aid oil prices. Moreover, the Kingdom had acknowledged that it had pumped oil above the agreed quota for several day’s in June during the war between Israel and Iran and thus we remain sceptical as to whether that has been properly incorporated into OPEC’s report.
Nonetheless, should the situation remain as it appears currently, where OPEC members fail to meet their own output hike plan’s, it could potentially aid oil prices as there may be a lower amount of oil supply in the global markets.
However, should that not be the case or further oil output hikes are announced, it may have the opposite effect and could thus weigh on oil prices.
Oil Technical Analysis
WTI Cash Daily Chart
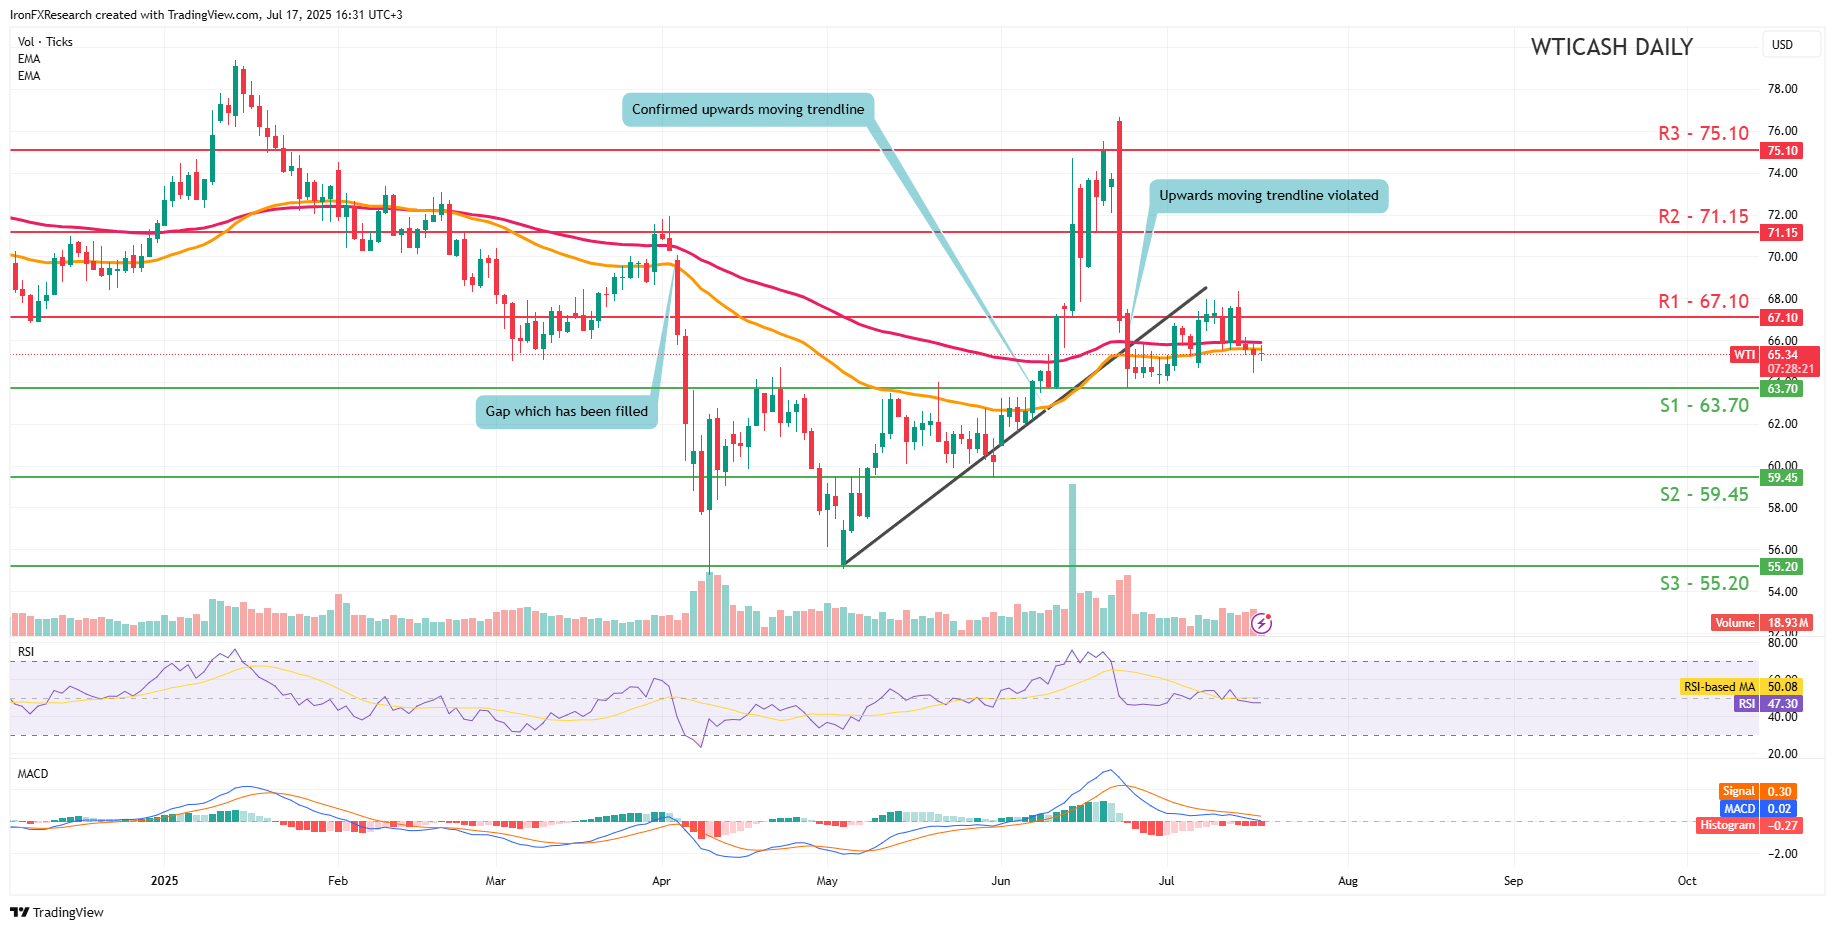
- Support: 63.70 (S1), 59.45 (S2), 55.20 (S3)
- Resistance: 67.10 (R1), 71.15 (R2), 75.10 (R3)
WTI’s price appears to be moving in a tight sideways fashion for the time being between our 63.70 (S1) support level and our 67.10 (R1) resistance line.
We cautiously opt for a sideways bias for the commodity’s price and supporting our case is the RSI indicator below our chart which currently registers a figure near 50, implying a neutral market sentiment. Yet the MACD indicator tends to showcase bearish market tendencies.
Nonetheless, for our sideways bias to be maintained we would require the commodity’s price to remain confined between the 63.70 (S1) support level and our 67.10 (R1) resistance line.
On the other hand, for a bearish outlook we would require a clear break below our 63.70 (S1) support line with the next possible target for the bears being the 59.45 (S2) support level.
Lastly, for a bullish outlook we would require a clear break above our 67.10 (R1) support level with the next possible target for the bulls being the 71.15 (R2) resistance line
Avertissement :
Ces informations ne doivent pas être considérées comme un conseil ou une recommandation d'investissement, mais uniquement comme une communication marketing


