

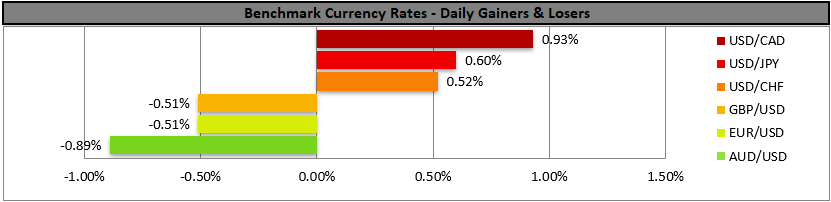
Markets weighing Warsh’s intentions
The nomination of Kevin Warsh as the next Fed Chairman by US President Trump created mayhem in the markets. The USD gained, US equities experienced a moderated drop and the crypto market retreated substantially.
A dove was anticipated to be nominated by Trump, while Mr. Warsh is considered as leaning more on the hawkish side. The markets were obviously taken by surprise and now are focusing on the next possible comments Warsh may make, and should they sound hawkish we may see the markets’ reaction intensifying in the coming days.
Also we highlight the drop of oil prices in today’s Asian session as the easing of market worries for a possible US attack on Iran eased, weighing on the commodity’s price.
RBA’s interest rate decision
The Aussie is losing ground against the strengthening USD, yet Aussie traders are focusing on the release of RBA’s interest rate decision in tomorrow’s Asian session. The bank is expected to hike rates, yet we are worried that the bank may prefer to remain on hold.
A possible hike accompanied also by a hawkish outlook, could provide support for the Aussie while a failure of the bank to hike rates could take the markets by surprise and cause AUD to lose even more ground.
Charts to keep an eye out
Oil prices were on the rise yesterday for a third day in a row as market concerns of a possible US attack on Iran mounted. At the same time, a tighter-than-expected US oil market and outages given the US winter storm helped lift oil prices.
Charts to keep an eye out
WTI’s price tumbled in today’s Asian session, breaking the 62.40 (R1) support line, now turned into a resistance level. We note that the upward trendline guiding the commodity’s price was broken in a first signal of an interruption of the upward movement yet the RSI indicator despite dropping failed to break below the reading of 50 which highlights the easing of the bullish market sentiment for WTI, yet no bearish sentiment has emerged yet.
Hence, we expect a possible stabilisation of the commodity’s price for the time being. For a bearish outlook to emerge we would require WTI’s price breaking the 59.80 (S1) support line, opening the way for the 56.00 (S2) support level. Should the bulls take over we expect the commodity’s price to break the 62.40 (R1) resistance line and continue to break also the 66.20 (R2) resistance barrier.
AUD/USD dropped on Friday hitting the floor at the 0.6940 (S1) support line stabilizing somewhat for now. The RSI indicator retreated below the reading of 70, implying an easing of the bullish market sentiment for the pair, yet the bullish predisposition of the market seems to remain for now.
Nevertheless, upward trendline which was guiding the pair for the past two weeks hence we switch our bullish outlook in favour of a sideways motion bias for now.
Should the bears take over, we may see AUD/USD breaking the 0.6940 (S1) support line and start aiming for the 0.6800 (S2) support level. For a bullish outlook to reemerge we would require AUD/USD’s price to break above the 0.7090 (R1) resistance line paving the way for the 0.7280 (R2).
Autres faits marquants de la journée :
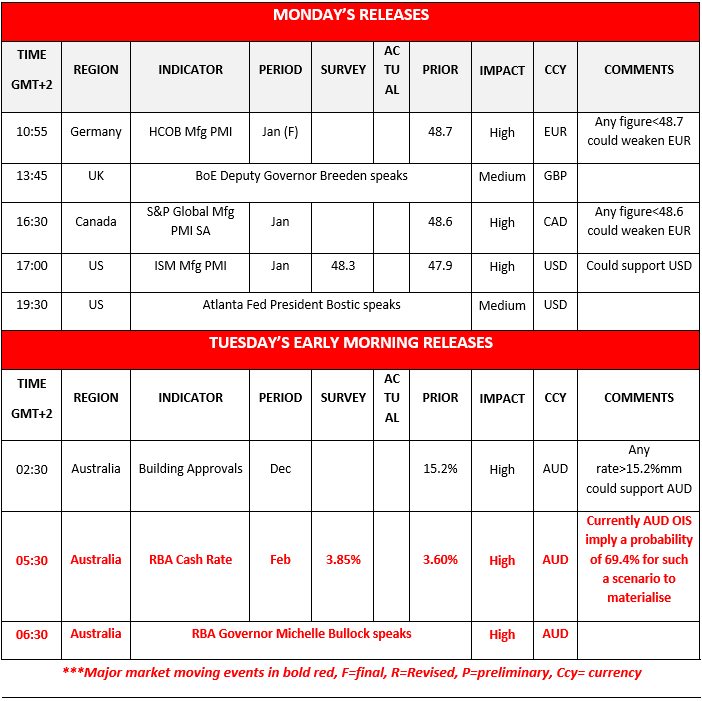
Today we get Germany’s HCOB, Canada’s S&P Global and the US ISM manufacturing PMI figures all for January, while in the UK BoE Deputy Governor Breeden and Atlanta Fed President Bostic speak. In tomorrow’s Asian session, we get Australia’s December Building approvals.
As for the rest of the week:
On Tuesday we get France’s preliminary HICP rates also for January and the US JOLTS job openings for December. On Wednesday we get Euro Zone’s preliminary HICP rate for January, the US ADP national employment figure for January and the ISM non-manufacturing PMI figure also for January.
On Thursday we get from the UK BoE’s interest rate decision, from the Euro Zone ECB’s interest rate decision, the US weekly initial jobless claims figure, and from the Czech Republic CNB’s interest rate decision. On Friday we get the US employment report for January and Canada’s employment data for the same month.
#WTI Daily Chart

- Support: 59.80 (S1), 56.00 (S2), 51.40 (S3)
- Resistance: 62.40 (R1), 66.20 (R2), 70.00 (R3)
AUD/USD Graphique H4

- Support: 0.6940 (S1), 0.6800 (S2), 0.6620 (S3)
- Resistance: 0.7090 (R1), 0.7280 (R2), 0.7455 (R3)

Avertissement :
Ces informations ne doivent pas être considérées comme un conseil ou une recommandation d'investissement, mais uniquement comme une communication marketing. IronFX n'est pas responsable des données ou informations fournies par des tiers référencés, ou en lien hypertexte, dans cette communication.


