
The release of the US PCE rates and GDP rates in the epicenter
The release of the Fed’s January meeting minutes, revealed the worries of some policymakers for the persistence of inflationary pressures in the US economy.
Today, we highlight the release of the US PCE rates for December, the Fed’s favourite inflation metric. Should the rates show a persistence or even an intensification of inflationary pressures in the US economy, we may see the USD getting support, as the market may be forced to ease its expectations for the Fed to cut rates.
On the flip side should the rates slow down beyond market expectations, we may see the USD retreat. Also, we highlight the release of the preliminary US GDP rate for Q4 25.
The rate is expected to slow down to 3.00%yy from prior 4.4%yy and a wider than expected slowdown could weigh on the USD as it would imply that the US economy grew at an even slower pace than expected.
Oil prices about to end the week in the greens
Oil prices continued to rise yesterday as market worries for a possible US-Iran conflict and a subsequent chocking point for the supply side of the international oil market, remain present.
Should we see the market’s worries being maintained or even intensify, we may see oil prices getting additional support.
US stock markets maintain a wait and see position
Major US equity market indexes remained stable over the past 24 hours, signalling a wait and see position ahead of today’s financial releases.
A possible acceleration of the PCE rates could weigh on US stock markets as it could harden the Fed’s position to remain on hold for longer and vice versa.
Overall, we still see the markets as leaning on the cautious side, given also a wider fundamental uncertainty in regards to the path of the US economy, the size of AI investments and the Fed’s intentions.
Autres points forts pour aujourd'hui
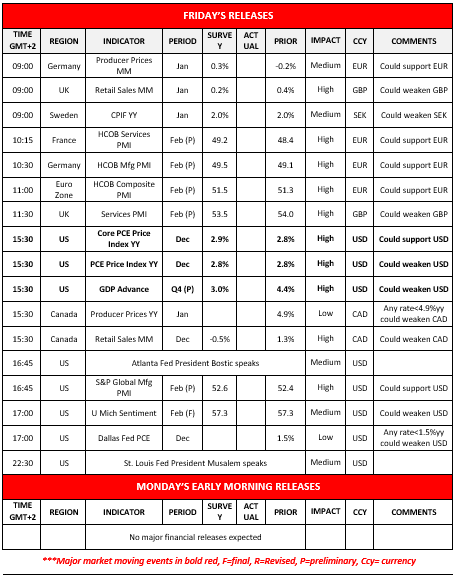
Today we get Germany’s producer prices, UK’s retail sales, Sweden’s CPI rates all for January, February’s preliminary PMI figures for Germany, France, the Euro Zone’s, the UK’s and the US, the US PCE rates for December, Canada’s PPI rates for January, Canada’s retail sales for December, the final US UoM Sentiment indicator for February and the Dallas Fed PCE rates for December.
On a monetary level, we note the speeches of Atlanta Fed President Bostic and St. Louis Fed President Musalem.
Charts to keep an eye out
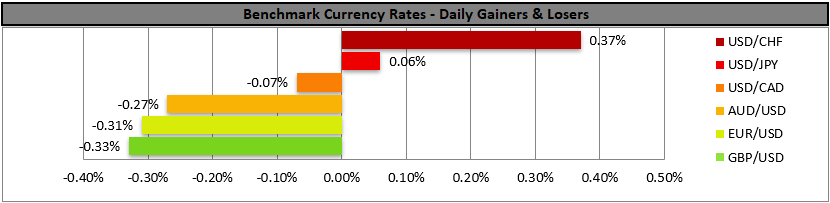
EUR/USD has befalling for the past week reflecting also the strengthening of the USD side of the pair and is currently aiming for the 1.1665 (S1) support line. The RSI indicator tends to imply a slightly bearish sentiment for the pair, and we expect the pair’s downward motion to be maintained for now.
Yet today’s US and European financial releases could alter the pair’s direction. Should the bears remain in charge we may see the pair breaking the 1.1665 (S1) support line and start aiming for the 1.1465 (S2) support level.
Should the bulls take over, we may see the pair reversing the losses of the past ten days and breaking the 1.1915 (R1) resistance line with the next possible stop for the bulls being placed at the 1.2115 (R2) resistance barrier.
WTI’s price continued to rally breaking the 66.20 (S1) resistance line and using it as a support level in today’s Asian session. We had recognised the bullish tendencies of the commodity’s price action in yesterday’s report and today we officially switch our outlook in favour of a bullish one.
Should the bullish outlook be upheld as expected, we may see the pair aiming for the 70.00 (R1) round resistance line. For a bearish outlook, which we currently see as remote, we would require WTI’s price action to break the 66.250 (S1) support line and continue to also break the 61.80 (S2) support level, with the next possible target for the bears being set at the 59.80 (S3) support base.
EUR/USD Quotidienne

- Support: 1.1665 (S1), 1.1465 (S2), 1.1260 (S3)
- Resistance: 1.1915 (R1), 1.2115 (R2), 1.2265 (R3)
WTI Daily Chart

- Support: 66.20 (S1), 61.80 (S2), 59.80 (S3)
- Resistance: 70.00 (R1), 73.35 (R2), 76.60 (R3)
Avertissement :
Ces informations ne doivent pas être considérées comme un conseil ou une recommandation d'investissement, mais uniquement comme une communication marketing. IronFX n'est pas responsable des données ou informations fournies par des tiers référencés, ou en lien hypertexte, dans cette communication.


