

Gold’s price corrected lower yesterday relenting any gains made since our last report. Today’s report is to discuss fundamental issues affecting gold’s price and we intend to focus on USD’s and gold’s negative correlation, market worries easing for Trump’s trade wars, the Trump-Putin meeting and we are to conclude the report with a technical analysis of gold’s daily chart.
USD-Gold negative correlation inactive
We begin the report by examining the validity of the negative correlation of the USD with Gold at the current stage. The movement of the USD Index over the past week was very subtle edging lower at the beginning yet correcting higher later on, yet gold’s movement was different having slight gains throughout the week and correcting abruptly on Monday.
Hence we currently view the negative correlation of the two trading instruments as currently being inactive. Also we note that US bond yields after dropping substantially on the 1 of August, have followed a slow but steadily upward direction, thus also signaling that the negative correlation of US bond yields and gold’s price is inactive.
Should we see a possible revival of the negative correlation of gold with the USD and should the USD be supported in the coming week, we may see the strengthening of the USD weighing on gold’s price in the coming days.
US-Sino trade truce extended
Overall in the past week we noted an easing of the market’s worries for Trump’s trade wars. The highlight may have been yesterday Monday as the US and China agreed to extend the pause of tariff hikes against each other’s products. Furthermore, we note that NVIDIA and AMD agreed to pay 15% of sales of chips in China to the US government, in another sign of easing of market worries.
Another issue that tended to weigh on gold’s price and was directly related to gold, was the US President’s post on social media that gold will not be tariffed.
The issue emerged after a US judge ruled that some gold bullion imports were subject to the tariffs announced by US President Trump. Should we see market worries for US President Trump’s trade wars ease further we may see gold’s price weakening.
Trump-Putin meeting to be the next riddle
Also we highlight the Trump-Putin meeting planned for Friday in Alaska. At the current stage, media are implying the possibility that a land swap may take place at which Russia will be allowed to keep Crimea and parts of Eastern Ukraine possibly for peace and a promise that Europe will not be invaded.
The issue tends to remain highly uncertain and the stakes remain high. It’s characteristic that last week, US President Trump threatened China and India with additional tariffs if they continue buying Russian oil, because in that way they finance Russia’s war in Ukraine.
Should we see the two sides reaching a deal or even nearing one, easing market worries, we may see gold’s price retreating. Yet we see Russia having little incentive to reach a deal at the current stage and should the two sides fail to reach a deal, we may see the market’s uncertainty rising substantially and thus providing safe haven inflows for the precious metal.
Upcoming financial releases that could affect gold’s price
The US CPI rates for July were just released and tended to provide some slight support for gold’s price. The release provided mixed signals for the markets as on the one hand the headline rate failed to accelerate as expected while the core rate accelerated beyond market expectations.
Should we see July’s PPI rates for the same month accelerating, providing a clearer picture for inflationary pressures in the US economy we may see the release weighing somewhat on gold’s price. It may take a substantial surprise for the markets, in the release of July’s US PPI rates to provoke a substantial move for gold’s price. Other than that, we also note the release of the US retail sales growth rate for July, yet overall we expect in the coming week, for fundamentals to lead gold’s price rather than financial releases.
Gold Technical Analysis
XAU/USD Daily Chart
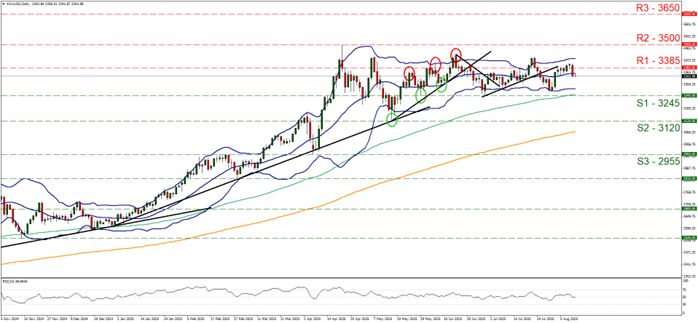
- Support: 3245 (S1), 3120 (S2), 2955 (S3)
- Resistance: 3385 (R1), 3500 (R2), 3650 (R3)
Gold’s price corrected lower on Monday, after breaking slightly the 3385 (R1) resistance line, practically relenting the gains made in the past week. The correction lower of the precious metal’s price, marked an interruption of the upward movement of gold’s price action.
It should be noted that the RSI indicator also corrected lower reaching the reading of 50 and implying an erasing of any bullish tendencies and a relative indecisiveness on behalf of market participants for the bullion’s direction. Furthermore, the Bollinger Bands despite some slight widening, tend to remain relatively narrow, possibly signalling a continuance of low volatility for the precious metal’s price, which in turn may allow the sideways motion to continue.
Hence we tend to maintain a bias for gold’s price to maintain its sideways motion at the current stage, between the 3385 (R1) resistance line and the 3245 (S1) support level. Should the bulls take charge of the precious metal’s direction, we may see its price action breaking the 3385 (R1) resistance line, this time clearly and start aiming if not reaching the 3500 (R2) resistance level which marks an all time high level for gold’s price.
Should the bears take over, we may see gold’s price breaking the 3245 (S1) support line and start aiming for the 3120 (S2) support level.
Avertissement :
Ces informations ne doivent pas être considérées comme un conseil ou une recommandation d'investissement, mais uniquement comme une communication marketing


