

Oil prices dropped substantially since our last report. In today’s report we are to discuss fundamental issues affecting oil prices and include the state of the US oil market, as well as the demand and supply sides of the international oil market. The report is to be concluded with a technical analysis of WTI’s daily chart.
US oil market tends to tighten
We make a start with the state of the US wti market. On Friday, Baker Hughes reported another decrease of the number of active oil rigs in the US, this time by 5, but we highlight the fact that the number of active oil rigs in the US has been reducing since April, in a sign of weakening oil demand.
On the flip side, API reported a wide drawdown of 4.2 million barrels, implying an overshoot of wti demand if comparted to production levels. Similarly EIA also reported a drawdown for the past week on Wednesday, this time of 3 million barrels. The drawdowns reported imply a relative tightness of the US oil market and should we see such signals being enhanced in the coming week, we may see wti prices getting some support.
Oil Demand may ease
In the demand side of the international oil market, we note that consumption tends to ease. It’s characteristic that economic activity in the US and Chinese manufacturing sectors was in the negatives, as indicated by the relative PMI figures. In turn, lower economic activity, may imply an easing of oil demand in the prementioned countries, which are considered as top wti consumers.
On a longer perspective, we highlight the international trading tensions as instigated by US President Trump. The US tariffs may have a negative effect on economic activity thus also on oil demand and consequently on the commodity’s price. Hence should we see international trading tensions escalating, we may see oil prices retreating in the coming week and vice versa.
OPEC’s production hikes
On the supply side of the international wti market we highlight OPEC’s decision to hike oil production levels. As per the oil producing organisation’s announcement oil production is to gradually and flexibly return the 2.2 million barrels per day voluntary adjustments and hike production levels in September by 547k bpd (barrels per day).
The decision adversely affected oil prices from Monday onwards, feeding the bears, and analysts are currently highlighting the possibility of a substantial glut in the international oil market, until the end of the year. Hence should we see in the coming week, OPEC officials citing the possibility of further increases of oil production, we may see them weighing on wti prices.
Yet we should note that the decision as such, is adequate to fundamentally keep oil prices under pressure, as OPEC’s intentions are in the clear.
US sanctions on Russian oil and its buyers
The US sanctions on Russian oil and its buyers have played a key part on wti prices’ behaviour over the past week. The fact that the US President has threatened to impose a 50% tariff on Indian products entering the US is typical of an overspill of politics in the economy.
The US President practically threatened India to cut purchases of Russian oil or face the consequences which in turn may create a bottleneck for the international oil supply chains. Yet, hopes may be on the rise as United States Special Envoy to the Middle East Witkoff seems to have achieved a substantial amount of progress in negotiations with Russian President Putin.
The progress mentioned in various media is so wide that US President Trump and Russian President Putin may meet as early as next week. Should we see in the coming week any signals of a possible resolution or easing of US sanctions related to Russian oil, we may see oil prices slipping as tensions in the international oil supply chains may ease.
Oil Technical Analysis
WTI Cash Daily Chart
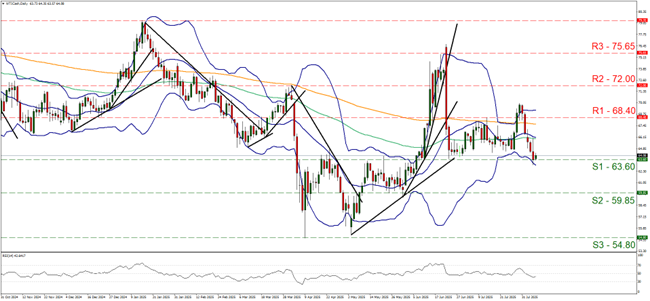
- Support: 63.60 (S1), 59.85 (S2), 54.80 (S3)
- Resistance: 68.40 (R1), 72.00 (R2), 75.65 (R3)
WTI’s price continued to drop for the past five days yet in today’s Asian session. bounced on the 63.60 (S1) support line. We see the case for the commodity’s price action to have reached a make or break position as it tests the S1. On the one hand, the bearish movement of the past five days was intense suggesting a possible bearish outlook. At the same time the RSI indicator seems to concur as it remains between the readings of 50 and 30.
The price action bounced after hitting the lower Bollinger band which in turn tend to maintain a downward direction at he current stage. Yet for the adoption of a bearish outlook we would require the commodity’s price to break the 63.60 (S1) support line clearly and start aiming for the 59.85 (S2) support level, a level that has proven its worth from the midst to the end of May.
A bullish outlook for the time being seems remote, and for its adoption we would require WTI’s price action to reverse direction, break the 68.40 (R1) resistance line and start aiming for the 72.00 (R2) resistance barrier.
Avertissement :
Ces informations ne doivent pas être considérées comme un conseil ou une recommandation d'investissement, mais uniquement comme une communication marketing
