
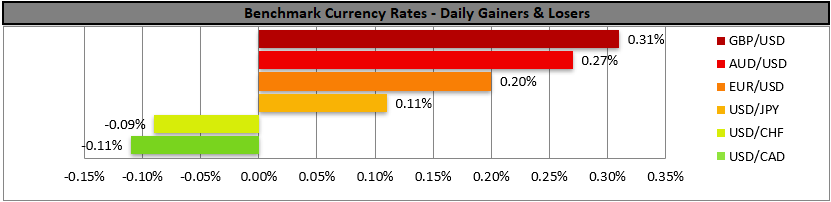
USD edged lower, while JPY is wobbling
In the FX market, the USD edged lower against its counterparts yesterday, yet recovered some of the losses in today’s Asian session.
We also note the wobbling of the JPY and on a fundamental level, despite some hawkish hopes for BoJ being present, the dovish intentions of the Japanese government for the bank’s board, tend to cap any JPY gains for the time being.
NVIDIA’s earnings improve market sentiment
NVIDIA outperformed market expectations both on a revenue and an EPS level and seemed to also provide a confident forward guidance with particularly positive results for its hyperscaler section.
Overall, the release pushed NVIDIA’s share price 3% higher, and turned the market sentiment as more optimistic and risk-oriented, also pushing Nasdaq 1% higher.
Oil market focuses on US-Iran negotiations
Oil prices continued to edge lower yesterday and during today’s Asian session. The confirmation of a slack in the US oil market by EIA yesterday may have encouraged the bears.
Yet the oil market’s attention remains on the US-Iranian negotiations, which are to take place in Switzerland and a possible diplomatic thawing of the tensions in US-Iranian relationships could cause oil prices to tumble, while a possible failure could enhance the possibility of a US military action and cause oil prices to rally.
Bitcoin rallies as market sentiment improves
Bitcoin rallied yesterday, taking the markets by surprise. On a fundamental level, the improvement of the market sentiment given also the release of NVIDIA’s earnings report, the legal action of Terraform Labs against Jane Street and reports for returning ETF inflows for the crypto market, all tend to provide tailwinds for Bitcoin at the current stage.
금일 주요 경제 뉴스
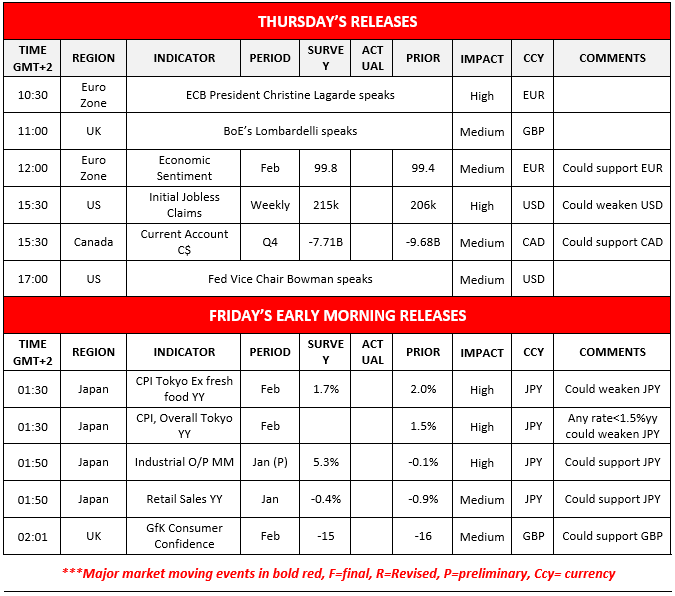
Today we get Euro Zone’s economic sentiment for February, the US weekly initial jobless claims and Canada’s current account balance for Q4. On a monetary level we note that ECB President Christine Lagarde, BoE’s Lombardelli and Fed Vice Chair Bowman are scheduled to speak.
In tomorrow’s Asian session, we get from Japan, Tokyo’s CPI rates for February, the preliminary industrial output for January, and retail sales for the same month, while from the UK we get February’s consumer confidence.
Charts to keep an eye out
WTI’s price continued to edge lower placing some distance from the 66.20 (R1) resistance line. Yet the RSI indicator remains above the reading of 50, implying that the market may still not be impressed by the drop of the commodity’s price.
For the time being, we remain unconvinced for the commodity price’s bearish tendencies on a technical level and highlight fundamental developments as an instigator for the WTI’s price direction.
For a bearish outlook to emerge we would require WTI’s price action to start actively aiming if not breaching the 61.80 (S1) line. For a bullish outlook to be adopted, WTI’s price action would have to recover the losses of the past two days, break the 66.20 (R1) resistance line and start aiming for the 70.00 (R2) level.
BTC/USD’s price rallied yesterday, breaking the 65000 (S1) resistance line, now turned to support.
Despite the rise of the crypto’s price the RSI indicator failed to breach above the reading of 50 failing to mark a bullish market sentiment for the crypto king.
Should the bulls take over, we may see the crypto breaking the 72500 (R1) resistance line and start aiming for the 81160 (R2) resistance barrier. Should the bears take over, we may see the pair breaking the 65000 (S1) support line and start aiming if not breaching the 60000 (S2) level.
WTI Daily Chart

- Support: 61.80 (S1), 59.80 (S2), 56.00 (S3)
- Resistance: 66.20 (R1), 70.00 (R2), 73.35 (R3)
BTC/USD Daily Chart

- Support: 65000 (S1), 60000 (S2), 49200 (S3)
- Resistance: 72500 (R1), 81160 (R2), 88000 (R3)
면책 조항:
본 자료는 투자 권유가 아니며 정보 전달의 목적이므로 참조만 하시기 바랍니다. IronFX는 본 자료 내에서 제 3자가 이용하거나 링크를 연결한 데이터 또는 정보에 대해 책임이 없습니다.


