

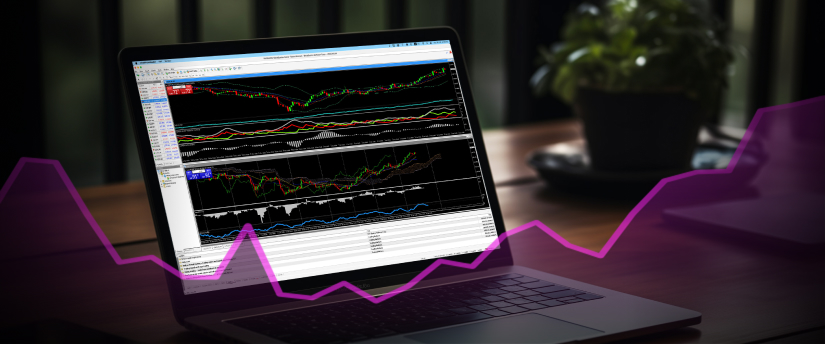
Since its launch in 2005, the MetaTrader 4 platform remains a leading platform for trading, primarily for forex but for other assets too. This is most often attributed to its range of indicators which are a core component of 기술적 분석. Some of the most widely used are Bollinger Bands, MACD, moving average convergence divergence), RSI, Relative Strength Index, Moving Average, Ichimoku Cloud, Awesome Oscillator, Stochastic Oscillator, Average True Range, Momentum, among many others.
Testing MT4 indicators
Testing an indicator is a general prerequisite before implementing it in live trading. There are many reasons for this. For one, testing can reveal whether the indicator accurately predicts market movements. It can also determine whether the indicator gives signals quickly enough for you to take action, or whether there is a lag. Third, testing will allow you to assess whether it effectively adapts to diverse market conditions after you’ve customised it.
Strategy Tester
There are numerous indicators available in the MetaTrader Market. Before making a purchase, you can download a demo version of an indicator and test it using the Strategy Tester. This can be achieved using the visual testing mode, where the indicator’s performance is displayed on a chart that is generated from a series of simulated ticks in the tester.
Choosing the indicator
To test an indicator, choose the “Indicators” program type in the strategy tester. Then, select an indicator from the list, which includes all indicators located in the terminal’s MQL4\Indicators folder (including subfolders). You can test any indicator from the Market for free before purchasing it. Simply download the demo version, double-click it in the Navigator, and click “Test.”
After selecting the indicator in the strategy tester, you only need to configure the parameters and start the testing process. If the indicator has input parameters, you can adjust them by clicking on “Indicator Properties” before beginning the test.
Starting the testing process
To test an indicator, choose the “Indicators” program type in the Strategy Tester. Then, select an indicator from the list. This includes all indicators located in the terminal’s MQL4\Indicators folder (including subfolders). You can test any indicator from the MT4 Market for free before purchasing it. Simply download the demo version, double-click it in the Navigator, and click “Test”.
After choosing the indicator in the Strategy Tester, you only need to configure the parameters and start the testing process. If the indicator has input parameters, you can adjust them by clicking on “Indicator Properties” before beginning the test.
Symbol and timeframe
To begin testing, it’s not enough to simply select and configure an indicator. You must also select a symbol and a timeframe for testing, as these provide the date used for the process. You can either choose a symbol available in the MT4 terminal or use an external data file. Testing relies on history data files in the *.FXT format, which are stored in the /TESTER directory. These files are created automatically during testing if you select a symbol from the terminal.
The symbol is specified in the corresponding field, while the timeframe is set in the “Period” field. If a data file for the selected symbo, timeframe, or modelling method doesn’t exist, it will be created automatically. Additionally, if no historical data is available for the symbol or timeframe, the tester will automatically download the latest 512 history bars.
Testing the indicator’s behaviour
The indicator’s behaviour is displayed on a chart that is generated based on a sequence of simulated ticks in the tester. The chart is created automatically once the testing process begins, and its name includes the financial symbol, the timeframe used, and the “visual” property. Logs of the indicator testing process are recorded in the “Journal” tab, which is similar to the one in the “Terminal – Experts” window.
The difference is that in the tester window, the logs are related to indicator testing rather than real chart operations. After testing is completed, these logs are saved in the /TESTER/LOGS directory. Log files are stored in the /EXPERTS/LOGS folder, with file names corresponding to the journal creation date in the format YYYYMMDD.LOG.

Reviewing the results
After the test is complete, it’s crucial to review the results. The Strategy Tester offers valuable metrics to assess your indicator’s effectiveness. First, look at profit and loss to see if the indicator consistently produced profitable trades or caused losses. Another metric is drawdown, which reflects the percentage drop from the peak equity value, helping you evaluate potential risks.
Additionally, consider the signal frequency. Establish if the indicator generated too many or too few signals, indicating possible overfitting or underfitting. You are able to analyse the results within the Strategy Tester or export them for more in-depth review.
Signing up for a demo trading account
No MT4 indicator is without error and having a proper understanding of how to use them is vital to be able to conduct proper technical analysis. One of the most practical ways to do this is by using a demo trading account which will likely give you access to the MT4 trading platform.
Pick your choice of indicator on the platform and learn how to apply it when taking trading decisions. The demo account gives traders the opportunity to learn how to trade in a simulated trading using virtual funds. They can conduct technical analysis and then enter and exit trades.
They can gauge outcomes and identify what needs to change in their own trading behaviours and plan to improve outcomes in a live trading environment. Having the time to acquire more skills and experience without putting your own capital at risk is likely going to help you gain the confidence you need to move to a real life trading.
IronFX에서 거래하기
We’ve already mentioned that MT4 indicators are not failsafe. Errors may occur so having a proper risk management plan in place to limit loss of funds when mistakes happen is important. Some of the most common risk management tools utilised are stop-loss orders to limit losses, take-profit orders to lock in gains, portfolio diversification, position sizing, cautious use of leverage, and working on strengthening your trading psychology.
In additional to conventional risk management tactics, another way to mitigate risk and protect your funds is to become a more informed trader through education. Reputable brokers like IronFX are a great source of fully comprehensive trading related resources. These vary, ranging from blogs, e-books, videos, seminars, webinars, podcasts, and much more. In addition, traders can also attend in-person exhibitions to engage with other trading enthusiasts and professionals in the field.
This offers a great way to exchange information, insights, concepts, and tips. For those that can’t get to an in-person event, there also exists a massive online community of traders, forums where traders can connect online and share data, ideas, and strategies.
IronFX에서 거래하기
Register with award-winning IronFX and enjoy a high quality, flexible trading experience, a range of tradable assets, multiple account types, and quick and easy trade execution. You’ll also be able to enjoy fast withdrawals and deposits, and market access via the MetaTrader 4 (MT4) trading platform, arguably one of the world’s most popular trading systems amongst global traders. The IronFX Academy also offers an abundant source of educational resources to boost one’s skills and acquire fundamental trading insights.
면책 조항: 본 자료는 투자 권유가 아니며 정보 전달의 목적이므로 참조만 하시기 바랍니다. IronFX는 본 자료 내에서 제 3자가 이용하거나 링크를 연결한 데이터 또는 정보에 대해 책임이 없습니다.


