
Since our last report, the price of Bitcoin appears to have retreated from the all-time high level of $73,500 per coin. Crypto bulls seem to have eased their aggressiveness somewhat yet a bullish sentiment seems to be still simmering under the surface and could flare up once again. In this report, we aim to shed light on the possible factors aiding to the recent developments in combination with a technical analysis of Bitcoin.
Crypto: Overview Report
The Fed’s interest rate decision
It’s interesting how Bitcoin bulls started to hesitate when the US CPI rates for February were released and the crypto king started correcting lower when the resilience of inflationary pressures in the US economy, was reaffirmed by the release of the PPI rates on Thursday. Hence we may see also the crypto market reacting to the Fed’s interest rate decision tomorrow. The bank is expected to remain on hold, keeping rates at the 5.25-5.50% range. Currently, Fed Fund Futures (FFF) imply a probability of 99% probability for such a scenario to materialise, rendering the interest rate decision largely as an open and shut case.
Hence we may see the market attention turning to the accompanying statement, the new dot plot and Fed Chairman Powell’s press conference, half an hour later, in an effort to find more clues about the bank’s intentions. We should note that FFF also imply that the market, currently, expects the bank to start cutting rates in June and deliver 3 rate cuts in total.
From a crypto perspective, we note the perception of the market for cryptos as riskier assets, so anything in the decision that could turn the market sentiment towards a more risk-oriented approach could support cryptos and vice versa. Hence breaking down the three prementioned remaining elements, we note that should the accompanying sentiment and Fed Chairman Powell’s press conference, be characterised by a hawkish tone, contradicting market expectations, we may see the market turning more cautious, thus exercising a bearish pressure on cryptos, while should the bank allow for some innuendos that rate cuts are nearing we may see cryptos getting some support.
On the other hand should the dot plot reaffirm the market’s expectations for a total of three rate cuts in the year, we may see cryptos rising, while should the dot plot imply fewer rate cuts, possibly two, we may see cryptos weakening.
Bitcoin’s halving nears
Crypto analysts have started to warn that Bitcoin may be about to enter a “danger zone” given that Bitcoin’s halving nears. The word in the market currently goes that Bitcoin’s price may start falling as historical pre-halving retraces begin as per Cointelegraph. Please note that any retracement of Bitcoin’s price lower, could have a substantial adverse effect, yet that remains to be seen. The halving of Bitcoin highlights how the original coding of the crypto limits the supply of Bitcoin and could add more appeal to the crypto king eventually.
Overall Bitcoin’s halving has one of the main drivers fundamentally of Bitcoin in the past weeks, supporting the crypto’s price. The issue of a possible retracement lower adds more uncertainty to the path of Bitcoin’s price and gains further on importance as despite Bitcoin’s halving being
centered around the specific crypto, it touches practically a huge number of investors, and also that Bitcoin serves as a flagship of the crypto-market.
Crypto Technical Analysis
BTC/USD Daily Chart
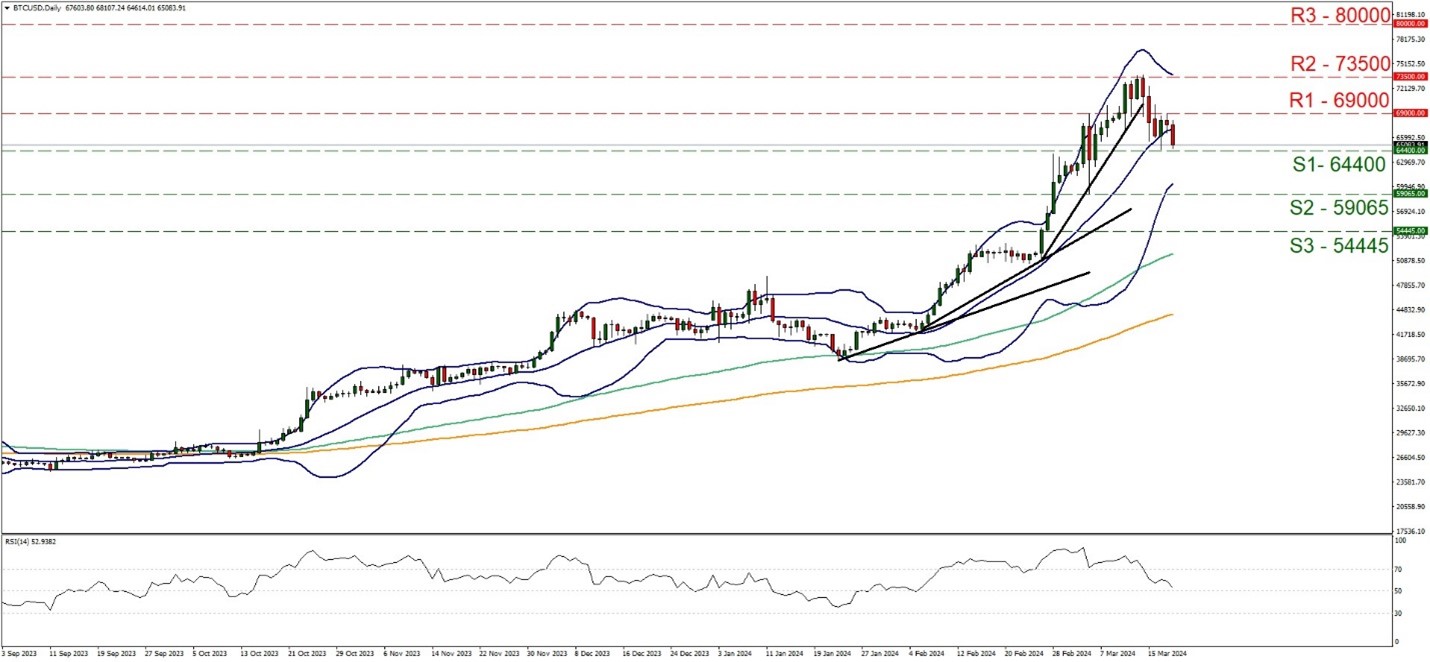
- Support: 64400 (S1), 59065 (S2), 54445 (S3)
- Resistance: 69000 (R1), 73500 (R2), 80000 (R3)
BTC/USD in the past week, hit a record high, near the 73500 (R2) resistance line and corrected lower, breaking the 69000 (R1) support line, stabilised somewhat, yet now seems to have renewed its bearish tendencies. For the time being, we tend to maintain a bias for the sideways motion to continue.
Yet, we have to note that the 20 moving average (MA), which is the median of Bollinger Bands, the 100 MA (Green line) and the 200 MA (Orange line) are all pointing upwards implying that the bullish outlook may still have some potential. On the flip side, the RSI indicator corrected substantially lower, and continues to fall, implying that the bullish sentiment may have faded, yet the indicator’s reading is still above the reading of 50.
or a bullish outlook, we would require the crypto’s price to break the 69000 (R1) resistance line, but also the 73500 (R2) resistance hurdle and start forming a new record high. On the flip side should the bears clearly take over, we may see Bitcoin’s price breaking the 64400 (S1) support line and start aiming if not reaching the 59065 (S2) support level.
면책 조항:
본 자료는 투자 권유가 아니며 정보 전달의 목적이므로 참조만 하시기 바랍니다. IronFX는 본 자료 내에서 제 3자가 이용하거나 링크를 연결한 데이터 또는 정보에 대해 책임이 없습니다.