
Oil prices moved higher since the beginning of the week, potentially due to the geopolitical tensions that have resurface in the Middle East. In today’s report, we are to have a look at the data relating to the US oil market and continue to view the fundamentals surrounding the international oil market. To conclude the report we will also provide a technical analysis of WTI’s daily chart.
In the Middle East, the drums of war are intensifying
Tensions in the Middle East continue to rise, with Iran seemingly poised to strike Tel Aviv after Israel allegedly killed Hamas’s leader Haniyeh in Iran’s capital Tehran. The assassination that occurred less than 24 hours after Iran’s new president Pezeshkian was sworn in, sent shockwaves across the region, as the possibility of an all-out war between the two nations appears to have re-emerged.
As a reminder, Israel and Iran exchanged blows after Israel struck Iran’s consulate in Damascus in April which resulted in a direct strike against Israel from Iranian territory. Hence, it was not a surprise to see the New York Times reporting yesterday evening that Iran’s supreme leader, Ayatollah Ali Khamenei issued an order for Iran to strike Israel directly in retaliation for the killing of Haniyeh in Tehran.
Therefore, with the retaliatory strike by Iran now seeming inevitable, concerns about the global oil supply appear to have risen, as instability in the region may cause concern over vital oil arteries flowing into Europe. In conclusion, should the tensions between the two nations continue to rise, with both sides retaliating against one another, it may lead to increased support for oil prices up until the situation de-escalates.
Tightness of US oil market remains
The data characterizing the current conditions of the US oil market seem to support the idea that the US oil market remains tight. On Friday, we note that the Baker Hughes oil rig count showed that active oil rigs were increased by five, in a sign that the demand side of the US oil market appears to be increasing. Furthermore, we note that on Tuesday, API reported that US oil inventories were reduced by -4.495 million barrels, which was wider than last week’s reduction of -3.9 million barrels, which tends to support the idea that the US oil market remains tight.
On Wednesday, we got EIA’s report about the US oil inventories, which also implied that the US oil market remained tight as it reported a drawdown of -3.436 million barrels, which was narrower than last week’s reported drawdown of -3.741 million barrels, but still tends to support the theory of a tight US oil market. Practically all three data related to the US oil market which were released since our last report, suggest that production levels in the US oil market are still unable to catch up with the aggregated oil demand.
Overall, the financial releases tend to have provided support for oil prices and should they continue to support the aforementioned theory in the coming week we may see oil prices moving higher.
China’s oil manufacturing sector worsens
One of the main concerns among oil traders continues to be the prospects of the China’s oil demand. In particular China’s NBS manufacturing PMI figure for July came in at 49.4, implying a contraction in manufacturing activity in China, yet the particular reading was already in contraction territory, as such it may have not been that big of a surprise as it was expected to drop to 49.4 from 50.3.
However, what was a surprise to market participants was China’s Caixin manufacturing figure for July, which unexpectedly dropped to 49.8 and entered contraction territory. Therefore, with both manufacturing indexes for China showcasing a contraction in manufacturing activity, it may fuel and intensify the concern surrounding China’s economic resilience.
In turn, given China’s status as the world’s largest oil importer, the reduction in manufacturing activity may translate to a reduction in oil demand, and thus may weigh on oil prices in the long run. In conclusion, should we see further signs of difficulty for the Chinese economy to recover, we may see market’s expectations for a deterioration of Chinese oil demand intensifying and thus exercising bearish pressures on oil prices.
기술적 분석
WTICash Daily Chart
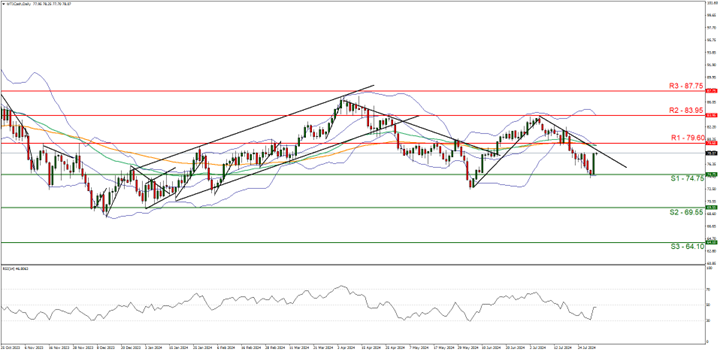
Support: 74.75 (S1), 69.55 (S2), 64.10 (S3)
Resistance: 79.60 (R1), 83.95 (R2), 87.75 (R3)
Oil’s price moved higher since the beginning of the week, potentially due to the fundamentals we mentioned above. Nevertheless, from a technical analysis standpoint we opt for a bearish outlook for the commodity and supporting our case is the downwards moving trendline which was incepted on the 8 of July, in addition to the formation of a death cross with the 50MA having currently crossed below the 100MA. However, the RSI indicator below our chart has jumped to near the reading of 50 from close to 30, which may imply that the bears appetite to push the commodity to lower levels may be decreasing.
Nonetheless, for our bearish outlook to continue, we would require a clear break below the 74.75 (S1) support level, with the next possible target for the bears being the 69.55 (S2) support line. On the flip side, we would immediately switch our bearish outlook in favour of a bullish outlook in the event of a break above the 79.60 (R1) resistance level, with the next potential target for the bulls being the 83.95 (R2) resistance line.
Lastly, for a sideways bias we would require the commodity to remain confined between the 74.75 (S1) support level and the 79.60 (R1) resistance line.
Should the bears maintain control over black gold’s price, we may see WTI’s price aiming if not breaching the 72.40 (S1) support line. For a bullish outlook, we would require WTI’s price action to break the 76.70 (R1) resistance line, continue higher to break the prementioned downward trendline, and reach, if not breach, the 80.25 (R2) resistance level.
면책 조항:
고지 사항: 본 정보는 투자 자문이나 투자 권유가 아닌 마케팅 커뮤니케이션으로 간주해야 합니다.


