

Oil prices moved higher since the last report, given also the easing of market worries for the tensions in the Middle East. In today’s report, we are to have a look at the data relating to the US oil market and continue to view the fundamentals surrounding the international oil market. To conclude the report we will also provide a technical analysis of WTI’s daily chart.
The mixed US data
Making a start with the situation in the US oil market, there have been some mixed signals, but let’s take a closer look. On Friday we got the weekly Baker Hughes US oil rig count, which showed a that the number of active oil rigs in the US was reduced from 485 to 483.
The reduction of active oil rigs in the US reported ended a rise of the indicator’s reading over the past three weeks, implying an easing of oil demand in the US oil market, which could have an adverse effect on oil prices.
On Tuesday we got the API weekly crude oil inventories figure, which unexpectedly rose showing a marginal increase of US oil inventories of 347k barrels, implying an easing of the tightness of the US oil market, which also tends to sent a bearish signal for oil prices. On the flip side EIA reported a drawdown of US oil inventories by -4.65 million barrels.
The drawdown was unexpectedly wide and as such implied that demand levels in the US oil market substantially surpassed production levels implying that the US oil market tightened. Overall, should we see data from the US oil market in the coming week, implying a tightening of the US oil market, we may see the data providing some support for oil prices.
Developments in the Middle East
Also on a fundamental level, we also highlight the dependence of oil prices to the developments in the Middle East, especially the negotiations between Hamas and Israel, with the mediation of the US.
It should be noted that US Secretary of State Anthony Blinken has proposed a possible ceasefire and hostage deal and Israel seems to be accepting, yet on the flip side Hamas has not answered yet. Blinken also noted that it may be the last chance for a ceasefire in the conflict adding more pressure on the two parties to accept and has left the region.
Yet there seem to be some thorns in the deal such as the end of war as such that Hamas is seeking, while Israel tends to view the ceasefire as temporary, the Israeli control over the Gaza-Egypt border, the return of displaced Palestinians, the return of hostages and of course the blame game which in turn may not allow for a deal to be struck.
Overall, should a deal be struck we may see the oil prices weakening as market worries for the international supply chain of oil may ease further. On the other hand, should the ceasefire deal not be struck, we may see gold’s price getting additional support as uncertainty over the developments in the area may be enhanced.
Please note that both sides have made steps towards escalating the tensions in the area, for example Hamas threatening to restart suicide bombings in Israel, while the possibility of Israel proceeding military action at the border with Lebanon, should not be underestimated.
The demand side and OPEC’s voluntary production cuts
Last but not least, we take a look at the fundamentals regarding the demand and supply sides of the international oil market. On the one hand there are worries for the demand side of the international oil market with China being the main source of worries. We note that analysts are highlighting that OPEC and IEA are revising downward their expectations for growth in the international oil demand and any further signal towards that direction could weigh on oil prices.
On the production side, we note the market worries for a possible slowing of demand growth may allow OPEC to maintain its low production levels, if not reduce them further, in order to counter the anticipated lower demand and thus provide some support for oil prices.
For the record we note that the 2.2mn b/d of voluntary production cuts by OPEC, have been in force since January, and an agreement was reached in June to unwind the cuts between October 2024 and September 2025 and given the new demand expectations the unwinding may be delayed.
기술적 분석
WTICash Daily Chart
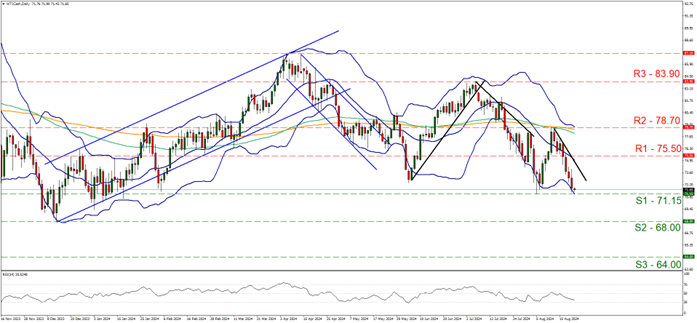
- Support: 71.15 (S1), 68.00 (S2), 64.00 (S3)
- Resistance: 75.50 (R1), 78.70 (R2), 83.90 (R3)
Oil ‘s price moved higher since the beginning of the week, potentially due to the fundamentals we mentioned above.
WTI’s price continued to fall constantly over the past week and is currently testing the 71.15 (S1) support line. We tend to maintain a bearish outlook for he commodity’s price action as long as the downward trendline guiding WTI’s price action since the 13 of August.
Also the bearish outlook is supported by the movement of the past week which has steepened its downward slope. Also the RSI indicator is nearing the reading of 30, implying the build-up of a strong bearish sentiment among market participants for oil prices. On the other hand, the commodity’s price action has reached the lower Bollinger band that may slow down the bears somewhat or even cause a correction higher.
Furthermore we note that WTI’s price action has reached a key support level that was able to reverse the commodity’s downward movement on the 5 of August. For our bearish outlook to continue, we would require a clear break below the 71.15 (S1) support level, with the next possible target for the bears being the 68.00 (S2) support line.
For a bullish outlook the bar is high, as the commodity’s price would have to rise break the downward trendline, in a first signal that the downward movement has been interrupted, and continue higher to break the 75.50 (R1) resistance line clearly and with the next possible target for the bulls being the 78.70 (R2) resistance level, marking a peak for WTI’s price action on the 13 of August.
면책 조항:
고지 사항: 본 정보는 투자 자문이나 투자 권유가 아닌 마케팅 커뮤니케이션으로 간주해야 합니다.


