
A certain degree of uncertainty tended to characterise US stock markets in the past few days, allowing for a sideways motion to be maintained, yet yesterday and during today’s Asian session, bearish tendencies seem to emerge yet tend to remain highly uncertain. In this report, we are to take a different approach than usual and focus mostly on major fundamental issues that surround the US stock markets and end the report with a technical analysis of a US stock market index for a more rounded view.
Fundamentals and risk events
Some market worries tend to stem from the possibility of a hard landing of the US economy from the rate hiking path of the Fed. It’s characteristic that the expansion of economic activity in the US manufacturing sector seems to be slowing down if not contracting for some months now. But also the non-manufacturing sector is experiencing a slowdown. Furthermore, the tightness of the US employment market is easing and it was characteristic that in the August employment report despite the NFP figure improving if compared to the respective revised July figure, the unemployment rate jumped to 3.8%. Overall the possibility of prolonging the usage of high interest rates by the Fed may have an intensified adverse effect on the US economy on a cumulative level and that seems to be the intention of the US central bank, in order to curb inflationary pressures. On a more positive note, the market seems to be solidifying its expectations for the Fed to remain on hold in its September meeting, a scenario that may imply that the tightening cycle of the bank has reached its end and tends to erase market worries for the possibility of the Fed going overboard. Any fresh indications, further solidifying the market’s expectations that the Fed has reached its terminal rate and is over with hiking rates is expected to boost market sentiment and thus support US stock markets. On the flip side, any further indications of a possible hard landing of the US economy may have an adverse effect on US equities. At this point, we would like to highlight as the next possible risk event for US stock markets the release of the US CPI rates for August next Tuesday and should the rates show an acceleration or even a stubbornness to slow down, we may see the market’s worries for the stance of the Fed intensifying and instigating a cautious stance that may weaken US equities markets.
Furthermore, we note also that the market seems to be worried for the recovery of the Chinese economy. It’s characteristic of how the Chinese manufacturing sector is struggling that the industrial output growth rate slowed down for July beyond market expectations while the NBS and Caixin manufacturing PMI figures for August, tend to send mixed signals. Specifically, the NBS manufacturing PMI figure remains below the reading of 50, thus implying a continuous contraction of economic activity since April. Furthermore, we would also like to highlight the troubles of the Chinese construction sector with companies like Evergrande, Country Garden and Logan Group being indicative of the situation. Overall any signals that the Chinese economy is slowing down are expected to force the market to adopt a more cautious stance, thus possibly weakening US stockmarkets on a fundamental level, as a considerable slowdown of the Chinese economy may cause an economic slowdown on a global level.
Arm’s IPO
There has been lots of buzz among market participants for the event of Arm Holdings Ltd going public. The Softbank’s company, which is a British semiconductor and software design company based in Cambridge, has already launched its roadshow, for what is considered to be the blockbuster IPO of the year. Currently, the company is trying to convince potential investors that it has a market value of $52 billion. Softbank is reported by Reuters to offer “95.5 million American depository shares of Cambridge, England-based Arm for $47 to $51 a piece and is looking to raise up to $4.87 billion at the top of the range”. The IPO and subsequent first day of trading is expected to be between the 13-15th of September. Furthermore, it’s being reported that the company has signed up a number of its major clients including Apple, Nvidia, Alphabet, Advanced Micro Devices, Intel and Samsung. Softbank is to own 90% of the share capital after the IPO and it also added that it will not receive any parts of the proceeds, a scenario that enhances, Arm’s potentials in the future. On a more fundamental level, given the nature of the company’s business segment, we highlight the risk factor involved as microchips are in the epicenter of the US-Sino trade wars and also tend to highlight any part of the company’s transactions with China.
Analisis Teknikal
US30 Cash, H4 Chart
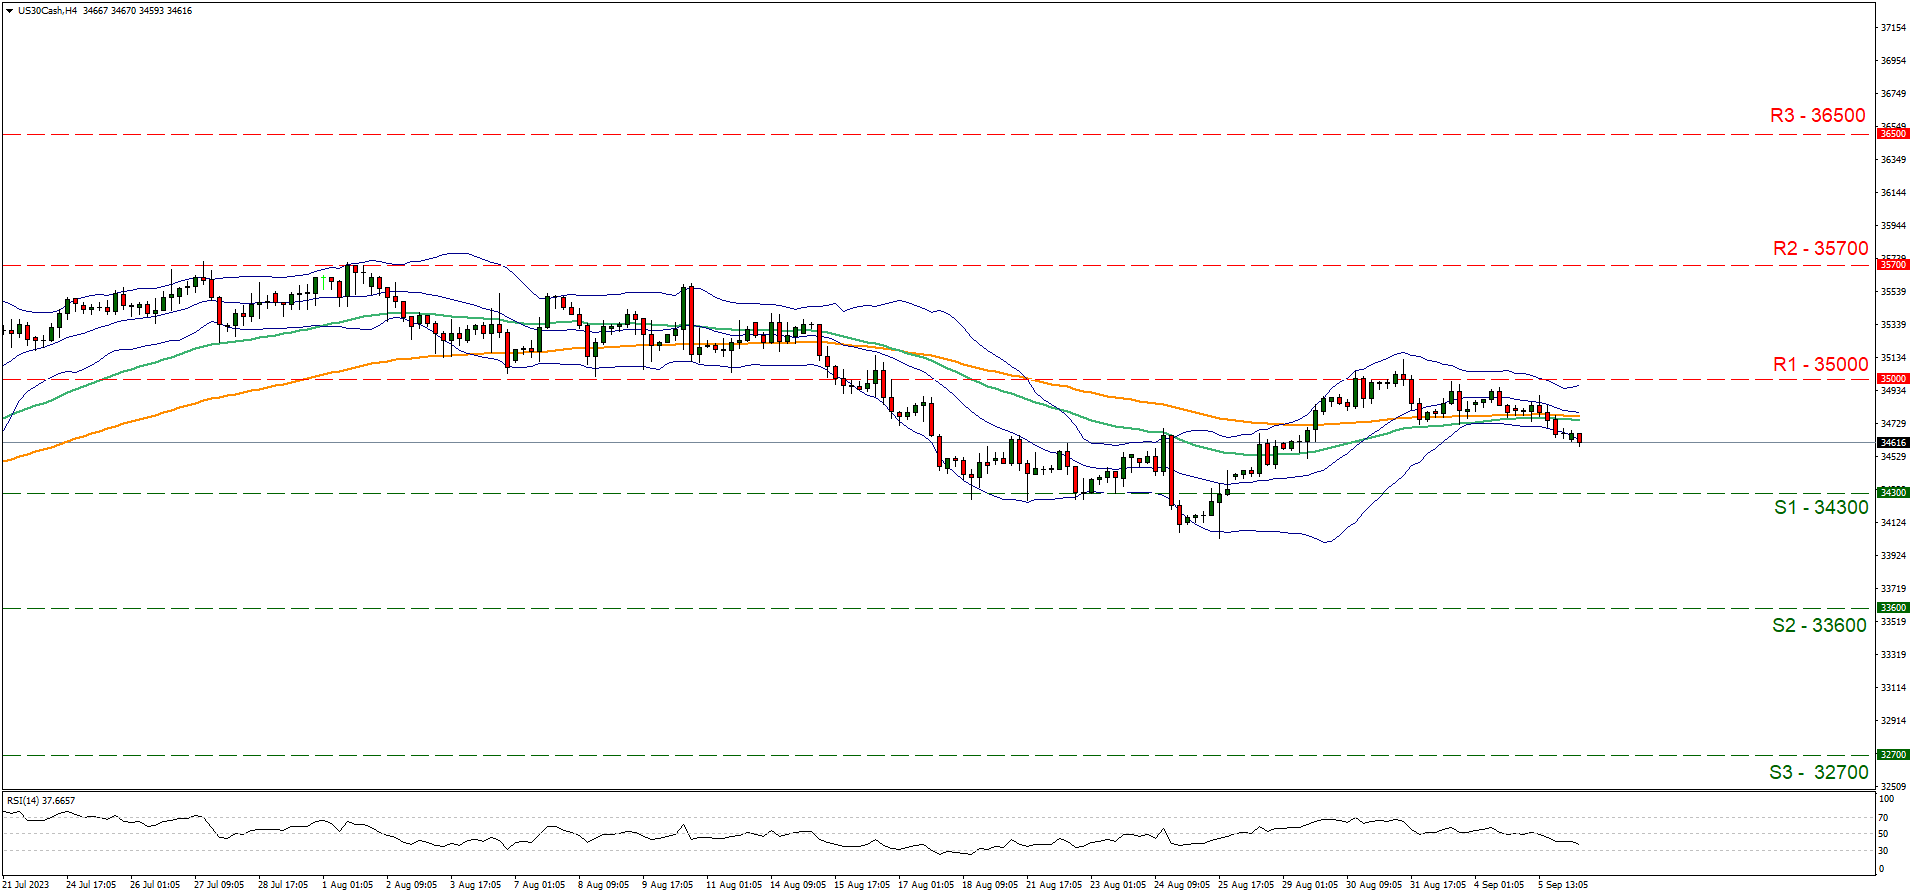
Support: 34300(S1), 33600 (S2), 32700 (S3)
Resistance: 35000 (R1), 35700 (R2), 36500 (R3)
Dow Jones edged lower over the past few days, yet the overall picture of a sideways motion between the 35000 (R1) resistance line and the 34300 (S1) support level, seems to be maintained. For the time being we tend to maintain our bias for the sideways motion to be continued yet note that there are indications of a possible bearish sentiment building up. It’s characteristic of the build-up of a bearish sentiment, that currently, the RSI indicator is nearing the reading of 30 while the Bollinger bands have started to take a turn lower, a move that the 50 moving average (green line) and the 100 moving average (orange line) have failed to pick up for the time being. We’ve widened the distance between the resistance and support lines, in order to better reflect the movement in the past few months, the nature of the weekly outlook and to cover the possibility of increased volatility in the coming days. Should the bears clearly take over, we may see the index breaking the 34300 (S1) support line that served Dow Jones well in the midst of August and despite being shallowly broken in its last days. Next possible targets for the bears could be set at the 33600 (S2) support level. On the other hand, should the bulls be in charge of the index’s direction we may see Dow Jones, breaking the 35000 (R1) resistance line which limited the index ascent on the last day of August and aim for the 35700 (R2) resistance line which capped the index’s upward movement on the 1st of August.
If you have any general queries or comments relating to this article please send an email directly to our Research team at research_team@ironfx.com
Disclaimer:
This information is not considered as investment advice or an investment recommendation, but instead a marketing communication. IronFX is not responsible for any data or information provided by third parties referenced, or hyperlinked, in this communication.