

US stock markets seem to have stabilised since our last report. In today’s report, we would like to address what fundamentally seems to be driving them, with a small comment for Boeing and Intel. Also, the earnings season is about to kick in and we conclude our report with a technical analysis of Nasdaq’s daily chart.
Busy Wednesday ahead of earnings season kickoff
The US employment report for March came in hotter than expected on Friday. The data tended to highlight the resilience of the US employment market and seems to provide some leeway for the Fed to maintain rates high for longer. Yet the market shook off any effect and it’s characteristic that US stock markets indexes ascended higher for the day. Hence we highlight the release of the Fed’s March meeting minutes later today. Should the document show that the Fed policymakers are hesitant to start cutting rates it could provide some bearish tendencies for US stock markets as the prospect of a prolonged tight financial environment in the US economy would be visible. Before that, we note the release of the US CPI rates for March and a possible failure of the rates to slow down or even a possible acceleration could add pressure on the Fed to keep rates high for longer and thus weigh on US equities. Furthermore, we note that on Friday the earnings season kicks off, with major US banks. Specifically we note the release of the earnings reports of JP Morgan (#JPM), Wells Fargo (#WFC), Citigroup (#C) and BlackRock (#BLK). We tend to view the earnings releases not only as mere data related to each company, but in a more aggregated form, also as a gauge of the health of the US financial sector. Given also that they are the first high profile companies to release their earnings report, the releases could set the tone for rest of the season.
Intel’s new chip
On a corporate level, we note the headlines regarding Intel’s new chip. The company’s latest Artificial Intelligence (AI) chip is called Gaudi 3 and the company stated that it is more than twice more efficient power-wise and can run AI models considerably faster than competitor Nvidia’s (#NVDA) respective chip, namely the H100 GPU. The company also mentioned that the new chip was tested on AI models of Meta among others in order to verify its effectiveness. The news are practically part of the Nvidia-Intel rivalry to dominate the fast-moving and highly competitive semiconductor sector. There is a relative frenzy of the market for AI as well, hence anything including the AI initials tends to get lots of attention and puts a plus sign in front of the relevant company’s share price. Hence the news could be considered as a positive for Intel (#INTC) and halt the downward motion of its share price in the past few days.
Boeing’s ongoing problems
Boeing’s (#BA) crisis seems to be deepening with another incident where the cover of a Boeing 737 engine was detached mid-flight. Furthermore, a whistleblower claimed that Boeing knew of the safety flaws concerning one of it’s largest aircraft carriers. The issue seems to relate to the 787 Dreamliner jet and has to do with the structural integrity of the plane and currently is under investigation by the Federal Aviation Administration (FAA) in the US. In the latest news Boeing’s CEO David Calhoun was summoned to testify before a Senate subcommittee about the company’s airplanes, which tends to intensify the uncertainty for the company’s outlook. Overall we see the situation getting worse before getting better, if it get’s better, and the dive of the share’s price over the past ten days is understandable and may continue if not intensify.
TECHNISCHE ANALYSE
US100 Cash Daily Chart
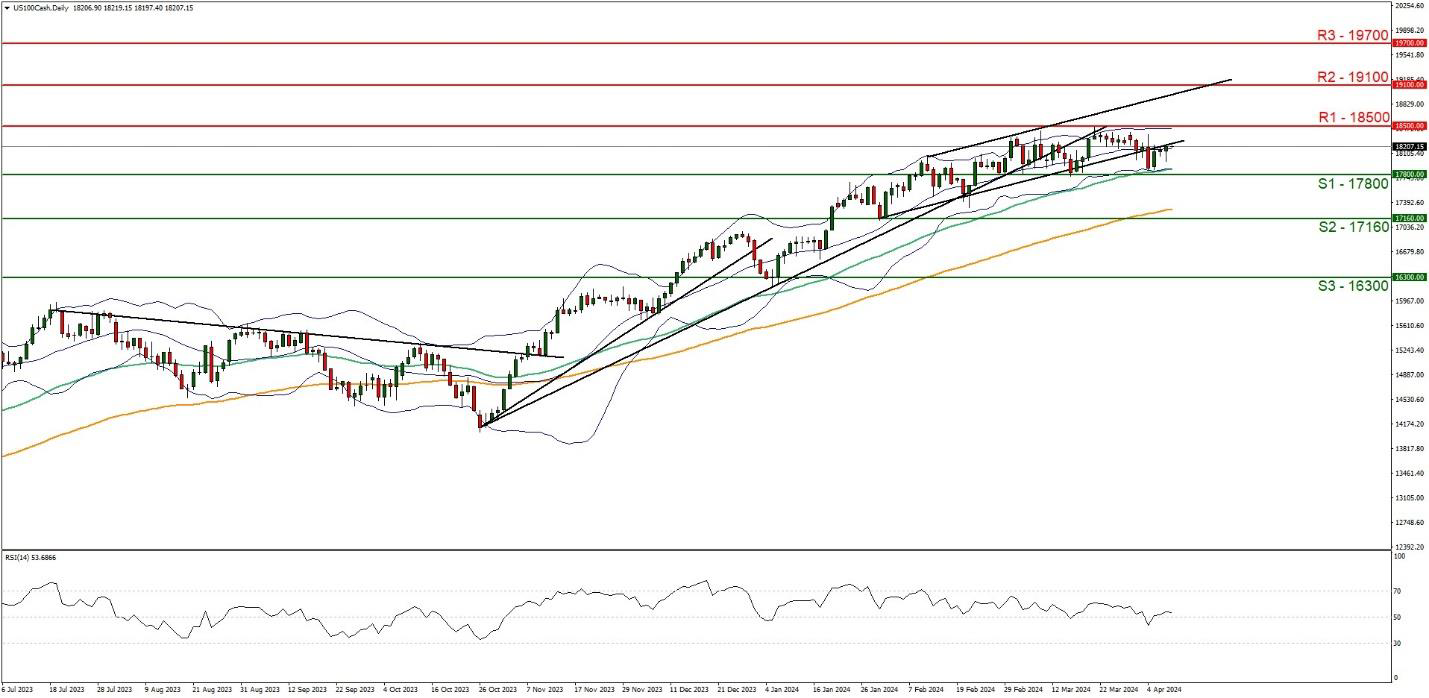
Support: 17800 (S1), 17160 (S2), 16300 (S3)
Resistance: 18500 (R1), 19100 (R2), 19700 (R3)
Nasdaq remained in a tight rangebound movement over the past few days, between the 17800 (S1) support line and the 18500 (R1) resistance line. We tend to maintain our bias for the sideways motion to continue as long as the price action of the index respects the prementioned levels. Please note that the sideways direction was highlighted by the breaking of the lower boundary of the past upward channel last week, sending a signal for the interruption of the upward motion while the bouncing on the 17800 (S1) support line underscored the lack of sufficient bearish tendencies. Furthermore, we note that the RSI indicator below our daily chart tends to remain close to the reading of 50, implying a rather indecisive market which could allow for the sideways motion to be maintained. On the other hand, the 100 Moving Average (MA, green line) and the 200 MA (orange line) are still pointing upwards, implying the existence of a bullish outlook for the index, but the 20 MA which is also the median of the Bollinger bands and has a faster reaction, has flattened out already. Hence to switch our current sideways movement bias in favour of a bullish outlook, we would require a clear breaking of the 18500 (R1) resistance line with the next possible target for the bulls being 19100 (R2) resistance level. Yet note that the R1 is an all-time-high level for the index, which understandably may be providing cold feet for the bulls. Should the bears take over the reins of the index’s direction, we may see Nasdaq’s price action breaking the 17800 (S1) support line, thus paving the way for the 17160 (S2) support base, that held its ground against downward pressure of the index’s price action on the 31st of January.
If you have any general queries or comments relating to this article please send an email directly to our Research team at research_team@ironfx.com
Disclaimer:
This information is not considered as investment advice or an investment recommendation, but instead a marketing communication. IronFX is not responsible for any data or information provided by third parties referenced, or hyperlinked, in this communication.


