
US stock markets appear to have recovered since their sharp drop. In today’s report we are to discuss the recent comments made by President Trump in regards to his possible meeting with Chinese President Xi Jinping. On a technical level we are to provide a technical analysis of S&P 500’s daily chart for a rounder view.
US-China trade meeting on ice?
The US appears to be keen on having President Trump and Chinese President Xi Jinping meeting face to face in order for the two leaders to have a sit down in regards to reaching an amicable trade deal. As a reminder, trade tensions between the two nation’s are running high and with the 1st of November deadline approaching, market participants may be jittery and eagerly awaiting any developments in regards to an extension of the ‘truce’ trade deal or any other developments. According to Bloomberg, President Trump noted that an upcoming meeting with President Xi could yield a “good deal”, with President Trump also stating that “Maybe it wont’t happen” when referring to his possible meeting with President Xi. Overall, should the two leaders failure to meet or it is reveal that communications have broken down between the two economic superpowers, market worries may resurface and may in turn weigh on the US Equities markets. However, should it appear that the trade truce may be extended or that talks may be progressing, it may instead aid the US Equities markets. Nonetheless, all eyes may be on the upcoming Asia-Pacific Economic Cooperation summit where the two leaders are both expected to be in attendance which could lead to new trade developments.
TECHNISCHE ANALYSE
US500 Daily Chart
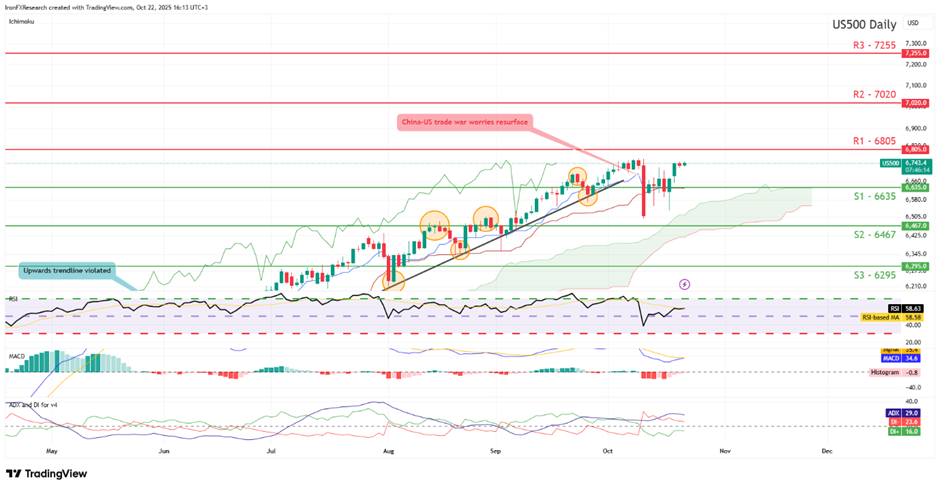
- Support: 6635 (S1), 6467 (S2), 6295 (S3)
- Resistance: 6805 (R1), 7020 (R2), 7255 (R3)
Since last week’s report, the S&P 500 appears to have recovered the losses it had made, with the index currently on track to take aim for our hypothetical 6805 (R1) resistance level. We cautiously opt for a bullish outlook for the index and supporting our case is the Ichimoku indicator as seen on our chart, in addition to the RSI indicator which has moved closer to the figure of 60, implying a bullish market sentiment. For our bullish outlook to be maintained we would require a clear break above our 6805 (R1) resistance level with the next possible target for the bulls being our hypothetical 7020 (R2) resistance line. On the other hand, for a sideways bias we would require the index to remain confined between our 6635 (S1) support level and our 6805 (R1) resistance line. Lastly, for a bearish outlook we would require a clear break below our 6635 (S1) support level if not also our 6467 (S2) support line with the next possible target for the bears being our 6295 (S3) support base.
If you have any general queries or comments relating to this article please send an email directly to our Research team at research_team@ironfx.com
Disclaimer:
This information is not considered as investment advice or an investment recommendation, but instead a marketing communication. IronFX is not responsible for any data or information provided by third parties referenced, or hyperlinked, in this communication.