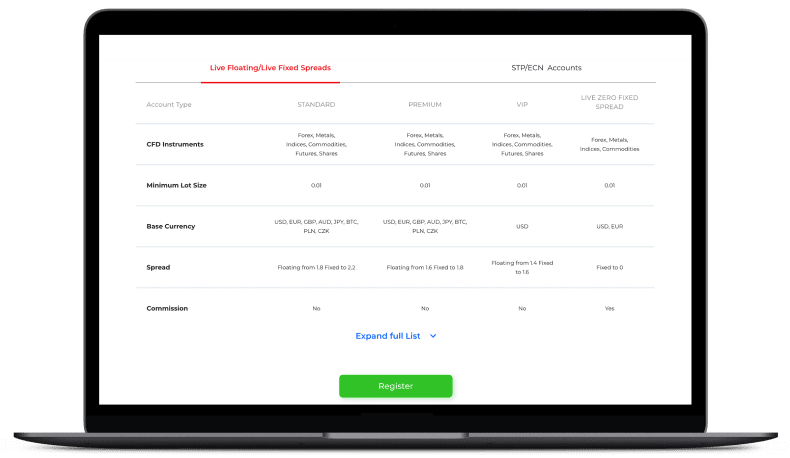
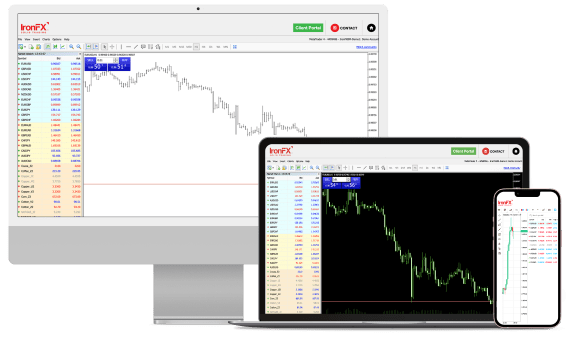
Observar os comentários diários e tomar decisões com informação

Registro

Timeframes and their importance

At the current lesson we are to discuss the importance of timeframes in charting analysis and its relation to trading style.

In our previous lesson we discussed the various chart types and specifically we mentioned that for the bar chart and the candlestick chart, a bar or candlestick may represent different period of time for trading a particular instrument. At the is lesson we are to discuss the candlesticks charts, and the same principles also apply for bar charts. The period represented in a candlestick could be 1 minute, 5 minutes, 15 minutes, 30 minutes, 1 hour, 4 hours, 1 day, 1 week or 1 month. These are the timeframes available for a chart in the MT4, our trading platform. In every case the timeframe of any chart has to be defined, alongside the trading instruments name in order for the viewer to understand at what he or she is looking at. The reasons for using different timeframes when performing technical analysis are practically two.

The first has to do with the fact that different timeframes can provide different pictures of the trading instrument’s movement. It’s understandable that when we use a wider timeframe say for example a day chart, that would allow us to view a wider picture of the instrument’s movement into the past. It should be noted on the other hand that a wider timeframe pays less attention to detail. On the other hand a narrow timeframe, say for example the one hour chart would allow us to see more details yet would show us the trading history of the instrument for a shorter period. Thus it’s practically a trade-off between detail in the price action and trading history. You can see on my left an one hour timeframe candlestick chart of EUR/USD. At this chart each candlestick represents the value range EUR/USD had within one hour of trading. Note how each candlestick begins where the previous one ended. On my right side you can see the chart of EUR/USD in the one day timeframe. In this case each candlestick represents the range of values EUR/USD got in a full day of trading. It’s characteristic that the fullness of the one hour chart is being represented in the daily chart within only the last eight candlesticks of the daily chart.   Yet for a more complete technical analysis both are required. Hence, the novice trader is advised to start performing technical analysis with a wider time frame and then drill down to narrower timeframes. Such a tactic would allow the trader initially to get the big picture of the trading instrument’s movements and then focus on more detail as he drills down. For this purpose maybe three timeframe charts of the same instrument could be sufficient, as more could lead to an overload of information. Overall analysing on a technical level, charts of more than one timeframe, could allow the trader to grasp the full multidimensional character of the market.

The second reason for using different timeframes has to do with the trading strategy. It’s understandable that a scalper, who opens and closes positions in a matter of minutes may not be interested in the longer history of the trading instrument and instead focuses on the present with an acute interest latest movement. Such a trader may use a minute chart. On the other hand, a day trader, who opens and closes positions within the same day may not require the degree of detail provided by the minute chart and may prefer to use the one hour chart which also provides some degree of history. Last but not least a position trader who keeps a position open over weeks and months, may not be interested in the details of the one hour chart and may prefer a day or a weekly chart that provides a broader picture of the priceaction’s direction.

More or less that should allow you to understand the importance and use of timeframes, in our next video we are to discuss the trend.

Subscreva a nossa newsletter


    Tenha em atenção que o seu e-mail será utilizado exclusivamente para fins de marketing. Para mais informações, por favor leia o nosso Política de Privacidade
    Partilhar:
    Pesquisa de blogs
    Affiliate World
    Global
    Dubai, EAU
    28 February – 1 March 2022

    IronFX Affiliates

    iFX EXPO Dubai

    22-24 February 2022

    Dubai World Trade Center

    Meet us there!

    Campeonato Iron Worlds

    Grande Final

    Prize Pool!*

    *São aplicados T&C.

    iron-world
    iron-world

    Iron World

    16 de novembro a 16 de dezembro

    Depósito Mínimo $5,000

    Qualquer negociação implica riscos.
    É possível perder a totalidade do seu capital.

    The Iron Worlds Championship

    one-million

    Prize Pool!*

    planet-usd-thunder
    planet-usd-thunder

    Titania World

    De 15 de outubro a 15 de novembro

    Depósito Mínimo $3.000

    *T&Cs aplicáveis. Todas as negociações envolvem risco. É possível perder todo o seu capital

    Campeonato Iron Worlds

    one-million

    Prize Pool!*

    elements-desktop
    elements-mobile

    Tantalum World

    14 de setembro - 14 de outubro

    Depósito mínimo de $500

    *T&Cs aplicáveis. Todas as negociações envolvem risco. É possível perder todo o seu capital

    Obrigado por visitar IronFX

    Este website não é direcionado a residentes do Reino Unido e está fora do enquadramento regulamentar Europeu e do MiFID II, assim como das regras, orientações e proteções estipuladas no Guia da Autoridade de Conduta Financeira do Reino Unido.

    Informe-nos como pretende continuar.

    Obrigado por visitar IronFX

    Este website não é direcionado para residentes da UE e não se enquadra no regulamento europeu MiFID II.
    Por favor, clique abaixo se desejar continuar IronFX de qualquer forma.

    Campeonato Iron Worlds

    one-million

    Prize Pool!*

    Phosphora World

    14 August - 13 September

    Depósito mínimo de $500

    *T&Cs aplicáveis. Todas as negociações envolvem risco. É possível perder todo o seu capital