
Major US stock market indexes are still near their all-time high figures, with the S&500 and NASDAQ 100 moving lower last week. In today’s report we intend to focus on the implications of the US elections the upcoming financial releases stemming from the US and Google’s earnings report. The report is to be concluded with a technical analysis of S&P 500’s daily chart.
US Elections incoming
As of today, we are few days away from the US Presidential elections which will see the incumbent Vice President Harris (D) take on former President Trump (R) in a race that remains too close to call. In particular, it appears that Trump is leading in some polls for crucial swing states that could push him over the 270 electoral college threshold in order to clinch the US Presidency. However, despite the slight edge given towards Trump, the two candidates appear to be neck and neck on numerous fronts, and with the polls well within the margin of error, a clear-cut winner has yet to emerge with six days left to go until the US Presidential elections. Nonetheless, the heightened possibility of a Republican President in the White House could potentially provide support for US stock markets, whereas a Democrat as a President could weigh on US Equities. Yet, we would like to mention our concerns that with the race being this close, a greater degree of importance is being given as to which political party will be able to win a majority in both the House and the Senate or if they will each take control of one legislative branch of the US government. Moreover, as we stated last week, should the elections be decided by a narrow margin we may see Trump or Harris contesting the results which could prolong the entire process and thus weigh on US Equities as political uncertainty may lead to safe haven outflows from the US Equities markets
US PCE rate and Employment report in sight
In the coming days, we expect the release of some high-impact financial data from the US that could create increased volatility in the US Equities markets. Starting with the release of the US PCE rates for September on Thursday. The rates are expected to slow down, showing an easing of inflationary pressures in the US economy and if so could add more pressure on the Fed to proceed with its rate-cutting path maybe even with a faster pace. Thus such a release could further ease the tight financial conditions surrounding the US economy and thus in turn may aid US Equities. Yet, the most crucial financial release is expected to occur on Friday with the release of the US October employment report. The Non-Farm Payrolls figure is expected to drop to 115k if compared to September’s 254k, the unemployment rate to remain unchanged at 4.1% and the average earnings report also to remain unchanged at 4.0% yoy. Overall, in the event that the predictions made by economists are materialized, it could provide support for the US Equities markets as it could add pressure on the Fed to proceed with a faster easing of its monetary policy.
Google beats earnings expectations
Google(#GOOG) released its earnings report for Q3 yesterday, beating expectations by economists. In particular, the company reported $88.27 billion in revenue, and an EPS of $2.12 , beating revenue expectations by $2.05b and earnings per share expectations by $0.27. Overall,the earnings release by the company appears to have positively impacted Google’s (#GOOG) share price and in particular the announcement of the acceleration in Google’s cloud growth, which may imply that the AI infrastructure investment made, appears to be yielding positive results for the company. However, we would like to note that Microsoft (#MSFT) has publicly claimed that Google has engaged in shadow campaigns and in particular an astroturf group organized by Google “is designed to discredit Microsoft with competition authorities”. In turn, should the matter lead to an investigation by competition authorities or a legal battle between the two tech behemoths, it may weigh on the company’s stock price, although it is too early to say what the true impact may be or if there will be any.
Технический анализ
US500 Daily Chart
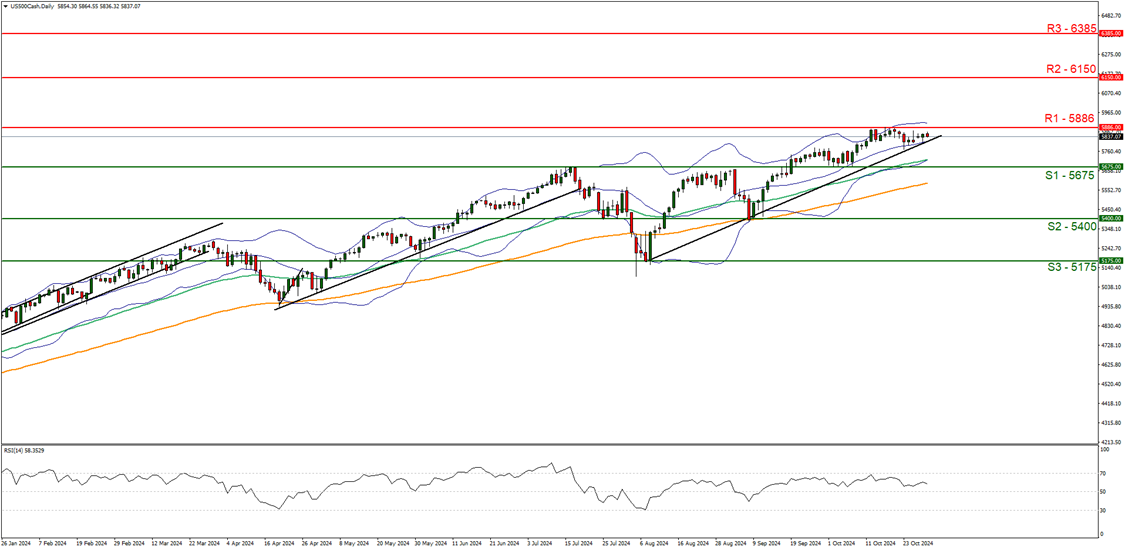
- Support: 5675 (S1), 5400 (S2), 5175 (S3)
- Resistance: 5886 (R1), 6150 (R2), 6385 (R3)
The US500 appears to be moving in an upwards fashion, yet some signs appear to be emerging that the bulls may be losing some steam. Nonetheless, we opt for a bullish outlook for the index and supporting our case is the upwards moving trendline which was incepted on the 8th of August. However, the RSI indicator below our chart currently registers a figure below 60, which may imply that the bulls may be relinquishing some control of the index’s direction. Nevertheless, for our bullish outlook to continue, we would require a clear break above the 5886 (R1) resistance line with the next possible target for the bulls being the 6150 (R2) resistance level. On the flip side for a sideways bias we would require the index to remain confined between the 5675 (S1) support level and the 5886 (R1) resistance line. Lastly, for a bearish outlook we would require a clear break below the 5675 (S1) support level with the next possible target for the bears being the 5400 (S2) support line.
If you have any general queries or comments relating to this article please send an email directly to our Research team at research_team@ironfx.com
Disclaimer:
This information is not considered as investment advice or an investment recommendation, but instead a marketing communication. IronFX is not responsible for any data or information provided by third parties referenced, or hyperlinked, in this communication.