
In the past week, US stockmarkets tended to reverse part of the losses made in the latter half of October. In this report we are to discuss the financial and fundamental environment surrounding US stock markets, the earnings reports released, and conclude with a technical analysis of Nasdaq’s daily chart.
Fed’s signals
Today we highlight the release of the Fed’s interest rate decision and the bank is widely expected to remain on hold, keeping rates at the range 5.25-5.50%. It’s characteristic of the market’s certainty, that Fed Fund Futures imply currently a probability of 99.5% for such a scenario to materialise. Furthermore, we note the market’s expectations for the bank to remain on hold until July 2024 and then proceed with a rate cut. Yet such expectations could be contradicted should the Fed decide to adopt a more hawkish tone in its accompanying statement and Fed Chairman Powell’s press conference later on. At this point, we have to note that inflation albeit slowing down is still at quite high levels yet the jump of the GDP rate at a preliminary level for Q3, is markable, economic activity seems to have increased in October for both the services and manufacturing sector and the US employment market tends to remain relatively tight. All of that tends to allow the Fed to maintain its hawkish stance and practically prolong the period at which high rates reign over the economy and probably that may be the Fed’s main message in the event. Should the tone actually be hawkish, we may see the market sentiment being contradicted and turning more cautious and thus weaken US stock markets, which are considered as riskier assets. On the other hand, should the bank’s hawkishness ease, given the slowdown of inflationary pressures in the US economy we may see US stock markets gaining.
The US employment report
On Friday we highlight the release of the US employment report for October. The unemployment rate is expected to remain unchanged at the relatively low level of 3.8%, the Non-Farm Payrolls figure to drop to 180k from September’s astounding 336k and the average earnings growth rate to slow down to 4.0% yoy if compared to September’s 4.2% yoy. Should the actual rates and figures meet their respective forecasts, we still see the US employment market as being quite tight given that the unemployment rate remains at relatively low levels and the drop of the NFP figure is understandable given September’s outsized rise. Overall such rates and figures tend to allow the Fed to maintain its hawkish tone and thus may weigh somewhat on US stockmarkets. Yet the element of surprise may be present and could create asymmetrical market responses at the time of the release.
Apple’s and other upcoming earnings releases
We note that earnings releases of the past week tended to intensify market worries for the path of hight tech US companies, with an adverse effect on their share price. We expect market focus to remain on earnings releases over the next seven days as several high-profile companies are scheduled to release their earnings reports. We highlight tomorrow Thursday the release of Apple’s earnings report. The company unveiled yesterday it’s new MacBook Pro featuring M3 chips, which are considered to make the laptop “scary” fast, creating some support for Apple’s share price. Tomorrow we would like to see whether the mega-cap high-tech company is going to be able to reverse the downward trajectory of its earnings and revenue figures over the past three quarters but would also be interested on any hints about the outlook of the aforementioned figures. On a busy Thursday, we also note the release of the earnings reports of Ferrari (#RACE), Starbucks (#SBUX), Novavax (#NVAX) and DropBox (#DBX). On Friday we get the earnings reports of Alibaba (#BABA), on Tuesday UBS(#UBS), EBAY(#EBAY), UBER(#Uber) and next Wednesday Disney (#DIS) and Lyft Inc.(#LYFT). Overall we expect that earnings releases could captivate the attention of the markets and create headlines in the coming week.
Phân tích kỹ thuật
US100 Daily Chart
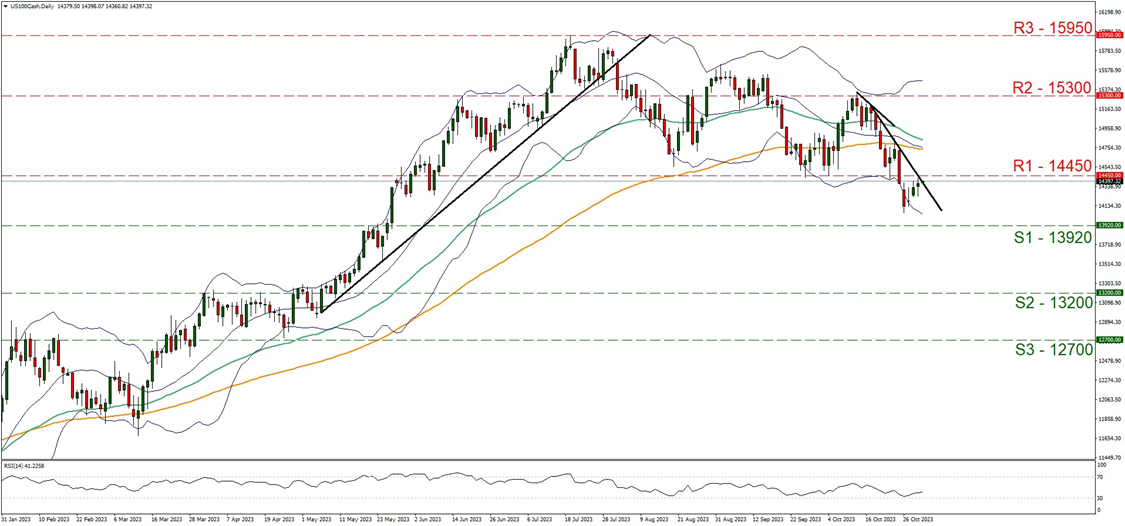
Support: 13920 (S1), 13200 (S2), 12700 (S3)
Resistance: 14450 (R1), 15300 (R2), 15950 (R3)
US100 Cash seems to have halted its downward trajectory over the past two days and currently seems about to test the 14450 (R1) resistance line. It’s characteristic that the downward motion was interrupted after the index’s price action broke the lower boundary of the Bollinger bands. It should be noted that the index’s price action seems prepared to break the downward trendline which started to form on the 17th of October and the RSI indicator bounced on the reading of 30, yet remains below the reading of 50, prolonging the ambiguity regarding the index’s direction. For a bullish outlook we would require the index’s price action to clearly break the prementioned downward trendline, signaling the interruption of the downward movement, but also break the 14450 (R1) resistance nest clearly and start aiming for the 15300 (R2) resistance level. Should the bears regain control we may see the index reversing the upward course of the past couple of days, possibly shifting the downward trendline to the right and start aiming for the 13920 (S1) support base.
If you have any general queries or comments relating to this article please send an email directly to our Research team at research_team@ironfx.com
Disclaimer:
This information is not considered as investment advice or an investment recommendation, but instead a marketing communication. IronFX is not responsible for any data or information provided by third parties referenced, or hyperlinked, in this communication.