
US stock markets moved higher, with the NASDAQ 100 and the S&P 500 posting gains since last week, yet the DOW JONES 30 Index appears to have weakened, following the announcement that a debt ceiling deal had been reached. However, until the debt ceiling bill is passed by congress, market worries tend to persist. In this report we aim to present the recent fundamental and economic news releases that impacted the US stock markets, look ahead at the upcoming events that could affect their performance and conclude with a technical analysis.
The final stretch for Lawmakers to pass the debt ceiling bill before the US Defaults.
Since last week, the S&P 500 和 NASDAQ 100 Indexes appeared to be reacting positively to news, that US President Biden 和 House Speaker McCarthy had reached middle ground in regards to agreeing to terms for raising the US debt ceiling, which would see the ceiling being raised for another 2 years, thus providing some stability for US stock markets in the long run. The debt ceiling included concessions from both parties in order to appease both sides of the isle, who are expected to vote on the bill today in the House of Representatives and should it pass, it will be handed over to Senate before making its way to US President Biden’s desk to be signed into law. The prospect of the US preventing its self-imposed debt default, which allowed markets to gain momentum and aim for higher ground, as market worries of a recession were decreased. However, following statements that there was significant opposition from both Democratic 和 Republican lawmakers to vote in favour of the bill, market worries were heightened, as the possibility of a US default was back in play, hence, given the new ‘X-Date’ set by Treasury Secretary Yellen which may be as soon as June 5 , the equities markets edged lower. However, equity traders may also be concerned with the release of the JOLTS Job Openings figure which is due during today’s American session. However, the highlight of the week for equity 交易員 could likely be the US Employment data on Friday, where the labour market tightness is to be seen, with market analysts anticipating that there is a slight deterioration in the tightness of the employment market, thus potentially weakening the US equities markets as consumers may be faced with less disposable income to spend on goods, should the predicted reduction in average hourly earnings, come to fruition. In conclusion the possibility of the US defaulting on its debt, as a result of political pushback may have soured the market sentiment around the US equities markets, as we edge closer to the US default.
NVIDIA(#NVIDIA) temporarily reaches a $1 trillion market valuation.
The main reason behind NASDAQ 100 spectacular rise the last few days, could have been the earnings report by now chip behemoth NVIDIA, which projected that its sales would rise to $11 billion for the three months ending in July compared to Wall street’s forecast of $7.2 billion. In addition, the company announced that it anticipates that other companies such as Apple (#AAPL) and Google (#GOOG) would potentially use its GPUs to create alternatives to compete against ChaptGPT, boosting market optimism around the company’s future earnings. Furthermore, the AI continued hype surrounding this announcement, facilitated NVIDIA’s meteoric rise to a temporary market valuation of $1 trillion and thus carrying the NASDAQ 100 index on its shoulders to the moon.
技术分析
#NVIDIA 4Hour Chart
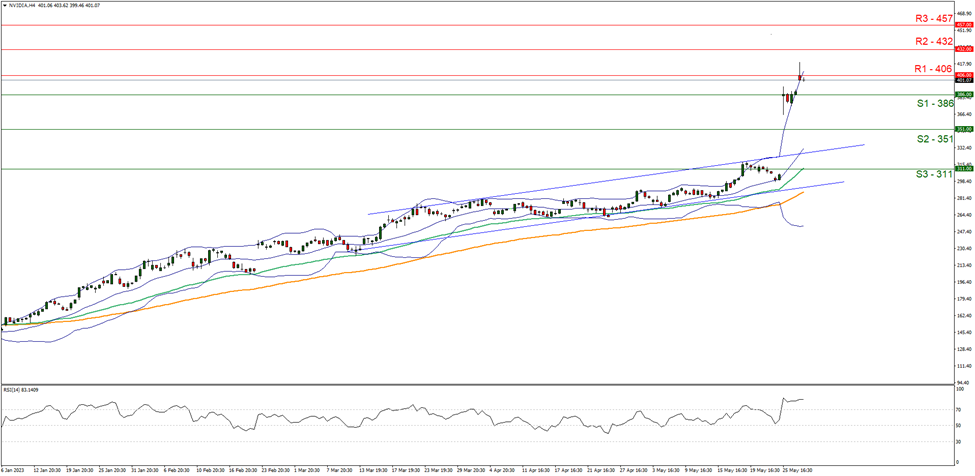
Support: 386 (S1), 351 (S2), 311 (S3)
Resistance: 406 (R1), 432 (R2), 457 (R3)
Looking at #NVIDIA 4Hour chart we observe investors reacting favorably to the earnings report as stock skyrocketed to levels last seen in July 2020, in addition to the company temporarily reaching a $1 trillion market valuation. We hold a bullish outlook bias for NVIDIA and supporting our case is the RSI figure under our 4Hour chart, which is well above the reading of 50 and nearing the level of 100, implying significant bullish sentiment in the market. For our bullish outlook to continue, we would like to see a clear break above the 432 (R2) resistance line with the move towards the 440 (R3) resistance ceiling. For a bearish outlook, we would like to see a clear break below the 386 (S1) support line with the move towards the 351 (S2) support base. However, at this point we would also like to point out, that the RSI indicator being well above the figure of 70 could potentially indicate that the stock is overbought and as such may be due a market correction to lower ground.
如果您对本文有任何常规疑问或意见,请直接发送电子邮件至我们的研究团队,地址为 research_team@ironfx.com
免责声明:
本信息不被视为投资建议或投资推荐, 而是一种营销传播. IronFX 对本信息中引用或超链接的第三方提供的任何数据或信息概不负责.


