
Oil prices continued to be on the rise since last report, and the bullish sentiment for the commodity seems to remain present. In today’s report we are to have a look at the data relating to the US oil market, and continue to view the fundamentals surrounding the international oil prices. To conclude the report we will also provide a technical analysis of WTI’s daily chart.
Bearish signals in the US oil market?
There were some bearish signals stemming from the US oil market as on the one hand, we saw Baker Hughes reporting another decrease of active oil rigs in the US economy.
The release tended to signal reduced oil demand in the US oil market which could weigh on oil prices should it be extended. The case for oil bears tended to intensify in the late American session on Tuesday, as API reported an increase of US oil inventories by 2.264 million barrels, a figure erasing the drop reported the week before.
The release tended to imply the existence of a slack in the US oil market as demand was not able to catch up with production levels. For further confirmation of a the existence of a slack in the US oil market, we highlight the release of the weekly EIA crude oil inventories figure in today’s American session.
Should EIA also report an increase of oil inventories, then we may see the release having a bearish effect on oil prices as it would justify the picture provided by API. On the flip side, should EIA report a drawdown as it is currently being expected, it may muddle the waters for oil traders and ease any bearish effect.
OPEC’s demand outlook
On the demand side of the international oil market we note the statement of OPEC’s General Secretary Haitham Al Ghaisthat peak oil demand is not on the horizon.
The statement contradicted IEA’s forecasts, for demand in oil to peak before 2030, due to the rise of EVs and renewable energy sources. OPEC’s General Secretary stated that IEA’s comment was a “dangerous commentary, especially for consumers, and will only lead to energy volatility on a potentially unprecedented scale”.
He also undermined IEA’s forecasts by highlighting that oil demand growth is to remain strong in non OECD developing world, oil demand continues to increase sighting relative forecasts and that many parts of the world are witnessing a consumer pushback as populations comprehend the implications of ambitious and unrealistic net zero policy agendas.
We tend to expect the feud to be continued and despite OPEC being understandably biased, its influence over the international oil market remains relatively dominant.
China’s demand may still be weak
On the flip side, we also note that one of the biggest oil consumers world wide, China seems to have had a slow start for the year in oil demand. It should be noted that China is increasing its stockpiles, as also refineries seem to be reducing their output.
We also note the decline in oil imports by China, for the first five months of the year which if combined with mixed signals about growth of economic activity in the Chinese manufacturing sector, could imply that it may prove difficult for China to reach the market’s oil consumption expectations.
Should we see additional signals for a possible easing of economic activity in the Chinese manufacturing sector like the deceleration of China’s industrial output growth rate for May, we may see the market’s worries for the outlook of oil demand intensifying and weighing on oil prices.
The situation in the Middle-East
In addition to the classic demand-supply factors that affect oil prices, we highlight once again the uncertainty caused on a fundamental level, by the Israel-Palestina conflict.
It should be noted that market worries about the issue, tended to intensify in the past few days as the Israeli Defence Forces, including boots on the ground backed by tanks, warplanes and drones, moved further into the into the city of Rafah, killing eight people, as reported by Reuters.
At this point we also highlight the flaring up of the war in the northern Israeli border, with Hezbollah, threatening even third countries, which it considers as assisting Israel.
Overall the situation seems to be escalating further and could intensify market worries for a wider flare up in the area, that in turn could tighten oil supply even further and thus could have a bullish effect on oil prices.
技术分析
WTI Cash Daily Chart
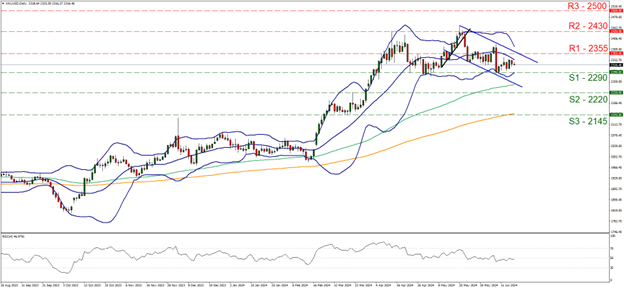
- Support: 80.25 (S1), 76.70 (S2), 71.85 (S3)
- Resistance: 84.10 (R1), 86.80 (R2), 89.50 (R3)
WTI’s price action broke above the 80.25 (S1) resistance line now turned to support. We tend to maintain a bullish outlook for the commodity’s price as long as the upward trendline guiding it since the 5 of June remains intact.
We also note that the RSI indicator is above the reading of 50, implying a bullish predisposition of the market for the commodity, while the 20 MA, which is also the median of the Bollinger bands has started to adopt an upward slope.
Should the bulls maintain control as expected, we may see the commodity’s price starting to aim for the 84.10 (R1) resistance line and should the R1 be broken we set as the next possible target for the bulls the 86.80 (R2) resistance hurdle, which was able to reverse the upward movement of the commodity’s price in the early days of April.
For a bearish outlook the bar is high as the commodity’s price action would have to beach the 80.25 (S1) support line, but most importantly WTI’s price action has to break below the prementioned upward trendline, in a first signal that the upward movement has been interrupted. Yet even that may not suffice for a bearish outlook as we would require WTI’s price to also break the 76.70 (S2) support base, thus paving the way for the 71.85 (S3) support barrier.
免责声明:
This information is not considered investment advice or an investment recommendation, but instead a marketing communication. IronFX is not responsible for any data or information provided by third parties referenced or hyperlinked, in this communication.


