
WTI’s price action , since our last report, seems to have stabilised since the start of the week and is about to correct lower. In the current report we intend to have a look at the state of the US oil market, yet also on an international level, discuss factors on the demand and supply sides that drive oil prices. To conclude the report we will also provide a technical analysis of WTI’s daily chart.
Oil: Overview Report
Slack in the US oil market
We make a start with the situation in the US oil market. It should be noted that the number of active oil rigs rose from 506 to 508 according to Baker Hughes. The release highlighted a halt in the closing of active oil rigs for the past three weeks in the US and tended to imply a possible rebound for the demand of oil, which may have had a bullish effect on oil prices.
On the other hand, API reported an increase of US oil inventories of 3 million barrels. The release reversed practically the drawdown reported the week before and was a first signal that the production levels surpassed oil demand in the US oil market enhancing some bearish tendencies for the commodity’s price.
On Wednesday the initial hunch for a slack in the US oil market was reinforced as EIA also reported an increase of oil inventories. Overall should there be additional signals for the slack in the US oil market widening we may see oil bears grabbing the opportunity and driving oil prices lower.
The strengthening of USD and the Fed
The release of the US CPI rates for March took the markets by surprise yesterday as the rates accelerated both on a core and a headline level. The release may add more pressure on the Fed to keep rates high for longer in order to curb inflationary pressures in the US economy.
Should tight conditions in the US financial environment be maintained for longer, we may see oil demand being driven lower as economic activity could ease in the US economy and especially the oil-thirsty manufacturing sector.
Furthermore, the release understandably provided support for the USD against its counterparts and the elevation of the USD could have as a side-effect, more expensive oil purchases for users outside the US, thus weighing on its demand on an international level.
Tensions in the Middle East remain high
Tensions in the Middle East remained high in the past week and the scenario of a possible strike of Iran on Israel is still present. Actually the possibility for such a scenario to materialise seems to rise and as long as the market’s worries about the issue intensify, we may see oil prices getting fresh support. In a latest update, US intelligence agencies expect an intensification of attacks from Iran on Israel.
A possible strike could take the form through proxies like Houthi rebels in Yemen, but also as a direct hit from Iran on Israel either by drones or by missiles.
The latter scenario tends to pose the greater threat of the two for instability in the international financial markets and may create mayhem to the oil market, with the commodity getting possibly asymmetric support.
OPEC’s report
On the production side of the international oil market, we highlight the release of OPEC’s report later today. We expect the report to highlight the low production levels planned by OPEC+ members, while at the same time, we would not be surprised to see the oil-producing organisation providing a forecast for a healthy demand for the commodity on a global. Overall we may see OPEC’s report having a bullish effect on oil prices.
Oil: Technical Analysis
WTI Daily Chart
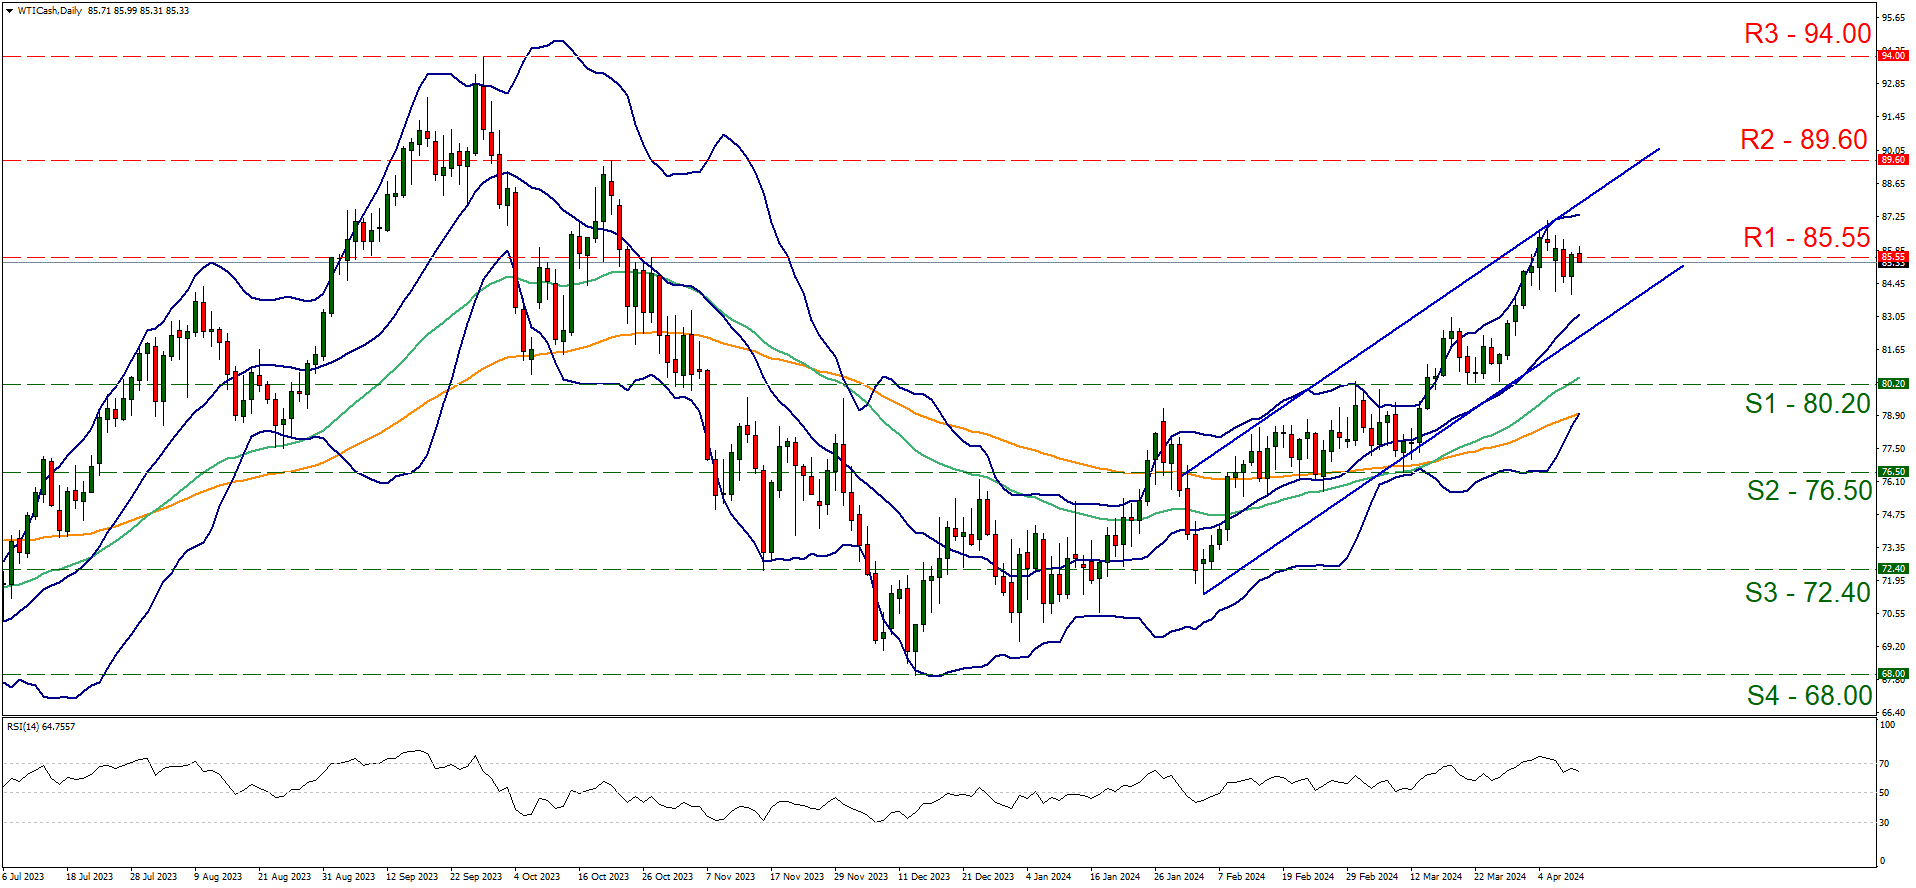
- Support: 80.20 (S1), 76.50 (S2), 72.40 (S3)
- Resistance: 85.55 (R1), 89.60 (R2), 94.00 (R3)
The rise of WTI’s price seems to have been temporarily halted and the price action seems to be revolving around the 85.55 (R1) resistance line since the start of the week. We note that the current stabilisation of WTI’s price action occurred once it hit the upper boundary of the upward channel guiding WTI since the 5th of February. Despite the relative stabilisation of the price action over the past few days, we tend to remain bullish for the commodity’s price and we base our outlook on three elements.
The first element supporting a bullish outlook would be the fact that the upward trendline remains intact. The second would be the RSI indicator which corrected lower, yet remains at pretty high levels, specifically just below the reading of 70, currently implying that a residue of bullishness is still being shared among market participants for oil.
The third element we would like to mention is that the 20 moving average (MA), which is also the median of the Bollinger bands, the 50 MA (Green line) and the 100 MA (Orange line) are all pointing upwards implying the possible continuance of the upward motion. Should the bulls actually maintain the initiative we may see WTI’s price breaking clearly the 85.55 (R1) resistance line turn it into a support line and take aim of the 89.60 (R2) resistance level.
Should the R2 be broken, we set as the next possible target for the bulls the 94.00 (R3) resistance barrier, a level that reversed the upward motion of the commodity’s price on the 28th of September last year and is currently the highest peak on our chart. Should the bears take over, we may see WTI’s price breaking initially the lower boundary of the upward channel signalling the interruption of the upward movement and continue lower to break the 80.20 (S1) support line. Should the S1 be broken we note the 76.50 (S2) support base as the next possible target for the bears, and even lower the 72.40 (S3) support level.
免责声明:
This information is not considered investment advice or an investment recommendation, but instead a marketing communication. IronFX is not responsible for any data or information provided by third parties referenced or hyperlinked, in this communication.


