
Oil prices have skyrocketed the past two days, with analysts citing a tight supply side, while the demand side tends to increase and remain tight as well. In this report, we aim to shed light on the factors driving WTI’s price, assess its future outlook and conclude with a technical analysis of Crude.
US oil market continue to tighten.
We make a start as usual with the data for the US oil market, with the US weekly crude oil inventories. The US weekly crude oil inventories figure, which was released during yesterday’s American session, was indicative of a reduction in the US oil inventories with the actual figure coming in at -2.170M barrels compared to the expected figure of -1.320M barrels. The higher-than-expected reduction in inventories, combined the OPEC+ production cuts being extended until the end of the year, appear to be forming a long-term view, of elevated oil prices. Furthermore, the organization foresees a supply shortfall of 3.3 million barrels per day in Q4 of 2023, which could strain the supply of oil into the markets, therefore as demand remains elevated and supply could potential become constrained, we may see the price of oil moving higher.
In addition, the US Strategic Petroleum reserve is near all-time lows, with the current inventories nearing levels last seen in 1983. As such, the lack of crude oil in the SPR, could weaken the ability of the US Government to push oil prices lower, which could allow the price of oil to move higher, as there may be reduced opposition from the US. In conclusion, we may see the price of oil elevated, yet still maintain our concern about external factors that may influence the price of oil.
Russia to uphold its agreement with OPEC+
Earlier on today, the Kremlin stated that the Russian Government would be sticking to their agreements with OPEC+ to reduce their oil productions up until the end of the year. The statement comes a day after Bloomberg reported that Russia was potentially using “shadow” tankers in an attempt to bypass European sanctions on Russian oil. According to the report, the tankers were spoofing their location in an attempt to conceal their identity and as such, concealing the origin of the tanker and of the liquid gold, which may potentially allow Russia to increase the supply of oil, whilst stating in public that it would uphold its agreement with OPEC+.
As such, in the event that reports surface that Russia has not been upholding its end of the deal and instead of reducing oil supply has been increasing supply and has been using “shadow” tankers, we may see the price of oil moving lower. However, we do highlight that despite the report by Bloomberg, it appears that price of oil remains unnerved and as such may not face any significant influence on its price. In conclusion, although the allegations of Russia evading sanctions using “shadow” tankers could in theory weigh on the price of oil, until concrete evidence emerges that Russia may not be upholding its terms with OPEC+ then we may see no impact on the price of oil. On the other hand, should concrete evidence emerge that Russia may not be upholding their agreement of reducing oil production, then we may see oil moving towards lower ground.
技术分析
WTI Cash Daily Chart
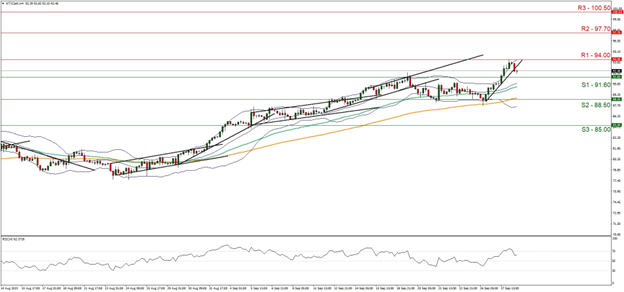
- Support: 91.60 (S1), 88.50 (S2), 85.00 (S3)
- Resistance: 94.00 (R1), 97.70 (R2), 100.50 (R3)
Oil’s upward movement was interrupted after failing to break above resistance at the 94.00 (R1). Despite the commodity currently having broken below our upwards moving trendline which was formed on the 26 of September, we tend to maintain a bullish outlook for the commodity. Furthermore, the RSI indicator below our 4-Hour chart currently registers a figure near 70, implying a strong bullish market sentiment.
Yet the price action seems to have hit the upper Bollinger band, which in turn may slow down the bulls. For our bullish outlook to continue, we would like to see a clear break above the 94.00 (R1) resistance and the 97.70 (R2) resistance levels, with the next possible target for the bulls being the 100.50 (R3) resistance ceiling.
On the other hand, for a bearish outlook we would like to see a clear break below the 91.60 (S1) support and the 88.50 (S2) support levels, with the next possible target for the bears being the 85.00 (S3) support base.
免责声明:
This information is not considered investment advice or an investment recommendation, but instead a marketing communication. IronFX is not responsible for any data or information provided by third parties referenced or hyperlinked, in this communication.


