
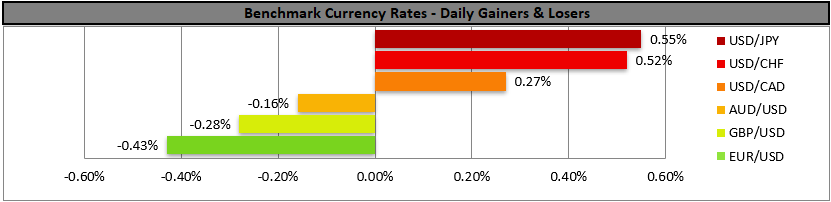
USD gains amidst tariff chaos
Amidst a chaos regarding Trump’s tariffs the USD gained in the FX Market. The US Supreme Court ruled that the legal basis the Trump Government used to frame the tariffs was note applicable, yet US President Trump invoked a different law and imposed a new tariff. The issue tends to create uncertainty in the global trading outlook and further uncertainty could support the USD. We also note in the FX market the release of Australia’s CPI rates for January and possible acceleration of the rates could take the markets by surprise and provide support for the Aussie.
US equity markets start the week on the backfoot
Market worries for AI investments and the possible disruptive role of the AI technology, continue to weigh on US stock markets. It’s characteristic that IBM’s share price plunged almost 12%, yesterday alone. In the current week, we highlight the release of NVIDIA’s earnings report tomorrow with the market’s focus expected to be not only on the rates and figures but also its forward guidance.
Oil prices edge higher
Oil prices edged higher as market worries for a possible US military action in Iran are intensifying. The US has amassed a fleet and a possible warning strike from the US on Iran, seems to be possible within the week, which in turn could increase tensions in the region. Should tensions in the US-Iranian relationships, escalate further we expect oil prices to get further support.
Increased risk-off sentiment weighs on Bitcoin
Bitcoin’s price action dropped yesterday and during today’s Asian session, with the bearish movement being fuelled on a fundamental level possibly by an intensifying risk-off sentiment, amidst geopolitical risks and uncertainty in global trade, but also the weakening US economic outlook and the Fed’s intentions.
今日其他经济亮点
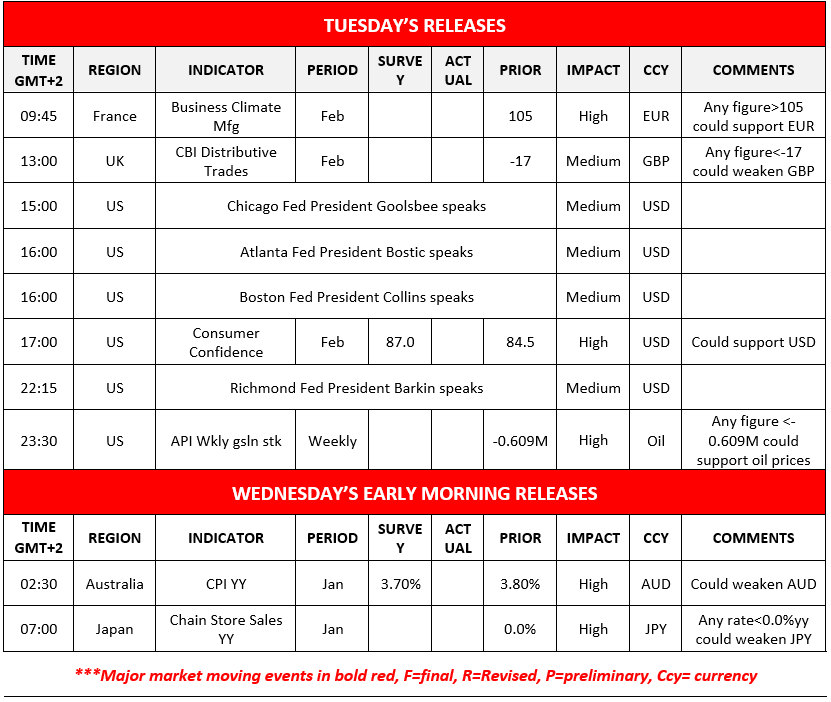
In today’s European session, we get France’s Business Climate for February and the UK’s CBI distributive trades for the same month and in the American session the US consumer confidence for February and later on, the API weekly crude oil inventories figure. On a monetary level, we note that Chicago Fed President Goolsbee, Atlanta Fed President Bostic, Boston Fed President Collins and Richmond Fed President Barkin are schedule to speak. In tomorrow’s Asian session, we Japan’s Chain store sales for January.
Charts to keep an eye out
AUD/USD remained relative stable between the 0.7145 (R1) resistance line and the 0.6940 (S1) support level. Given the stabilisation of the pair over the past two weeks we tend to maintain a bias for the sideways motion to continue. Should a bearish outlook to emerge we would require the pair to break the 0.6940 (S1) support line and start aiming for the 0.6800 (S2) support level. For a bullish outlook to be adopted, AUD/USD has to break the 0.7145 (R1) resistance line clearly and start aiming for the 0.7280 (R2) resistance barrier.
BTC/USD’s price action dropped breaking the 65000 (R1) support line, now turned to resistance. Given also the strong bearish market sentiment as displayed by the RSI indicator reaching the reading of 30, we switch our bias for a sideways motion for a bearish outlook. At the same time the positioning of the RSI indicator and the drop of the price action to the lower Bollinger band may imply that the crypto’s price has neared oversold levels, that could cause a correction higher. Should the bears maintain control, we may see the crypto aiming for the 60000 (S1) support line, while even lower we note the 49200 (S2) support level. Should the bulls take over, a scenario which we currently see as remote, the crypto could reverse its losses by breaking the 65000 (R1) line and continue to also break the 72500 (R2) resistance level.
AUD/USD Daily Chart

- Support: 0.6940 (S1), 0.6800 (S2), 0.6620 (S3)
- Resistance: 0.7145 (R1), 0.7280 (R2), 0.7455 (R3)
BTC/USD Daily Chart

- Support: 60000 (S1), 49200 (S2), 38500 (S3)
- Resistance: 65000 (R1), 72500 (R2), 81160 (R3)
免责声明:
本信息不被视为投资建议或投资推荐, 而是一种营销传播. IronFX 对本信息中引用或超链接的第三方提供的任何数据或信息概不负责.


