
Market attention may shift as traders reassess recent USD strength amid changing macroeconomic signals and shifting risk sentiment across global markets.
The US dollar’s earlier gains have started to correct lower as equities weaken and crypto markets remain under pressure, while investors look ahead to upcoming US employment data for clearer direction.
With volatility building across FX, equities, oil, and digital assets, markets are positioning for potential shifts in momentum driven by key economic releases and geopolitical developments.
USD’s gains corrected lower
The USD continued to rise yesterday in the FX market supported by safe haven inflows as mentioned in yesterday’s report. Also on the macroeconomic level, financial data indicating higher than expected economic activity tended to be supportive for the USD.
Today we highlight the last employment data, before the release of the US employment report for May, which may shift the market’s attention. A possibly tighter than expected US employment market could support the USD and weigh on gold and US equities.
Equities corrected lower
US equities corrected lower yesterday as Dow Jones, S&P 500 and Nasdaq ended their day in the reds.
Chatter among investors for SpaceX’s IPO is ongoing, with Musk reportedly controlling 84% of the voting rights after the IPO which is to set a $1.75T price tag on the company, while shorting the share is also widely discussed with Jefferies bank leading the way as per Bloomberg.
Bitcoin’s roll down continues
Bitcoin continued to roll down yesterday, with analysts highlighting a risk averse market sentiment weighing on the crypto market given the tensions in the Middle East.
Without disputing the explanation provided we tend to place more emphasis on the ETF outflows pressuring the crypto market as they signal a major weakness on its demand side as mentioned in yesterday’s report as well.
Prospect of Lebanon peace deal caps oil prices
Oil prices got some support yesterday on flaring tensions in the Middle East, yet the prospect of a peace deal in Lebanon tended to weigh in today’s Asian session.
Should we see the market’s hopes for a possible peace deal between the US and Iran and a subsequent reopening of the Straits of Hormuz be enhanced, we may see oil prices losing further ground and vice versa.
Other highlights for today
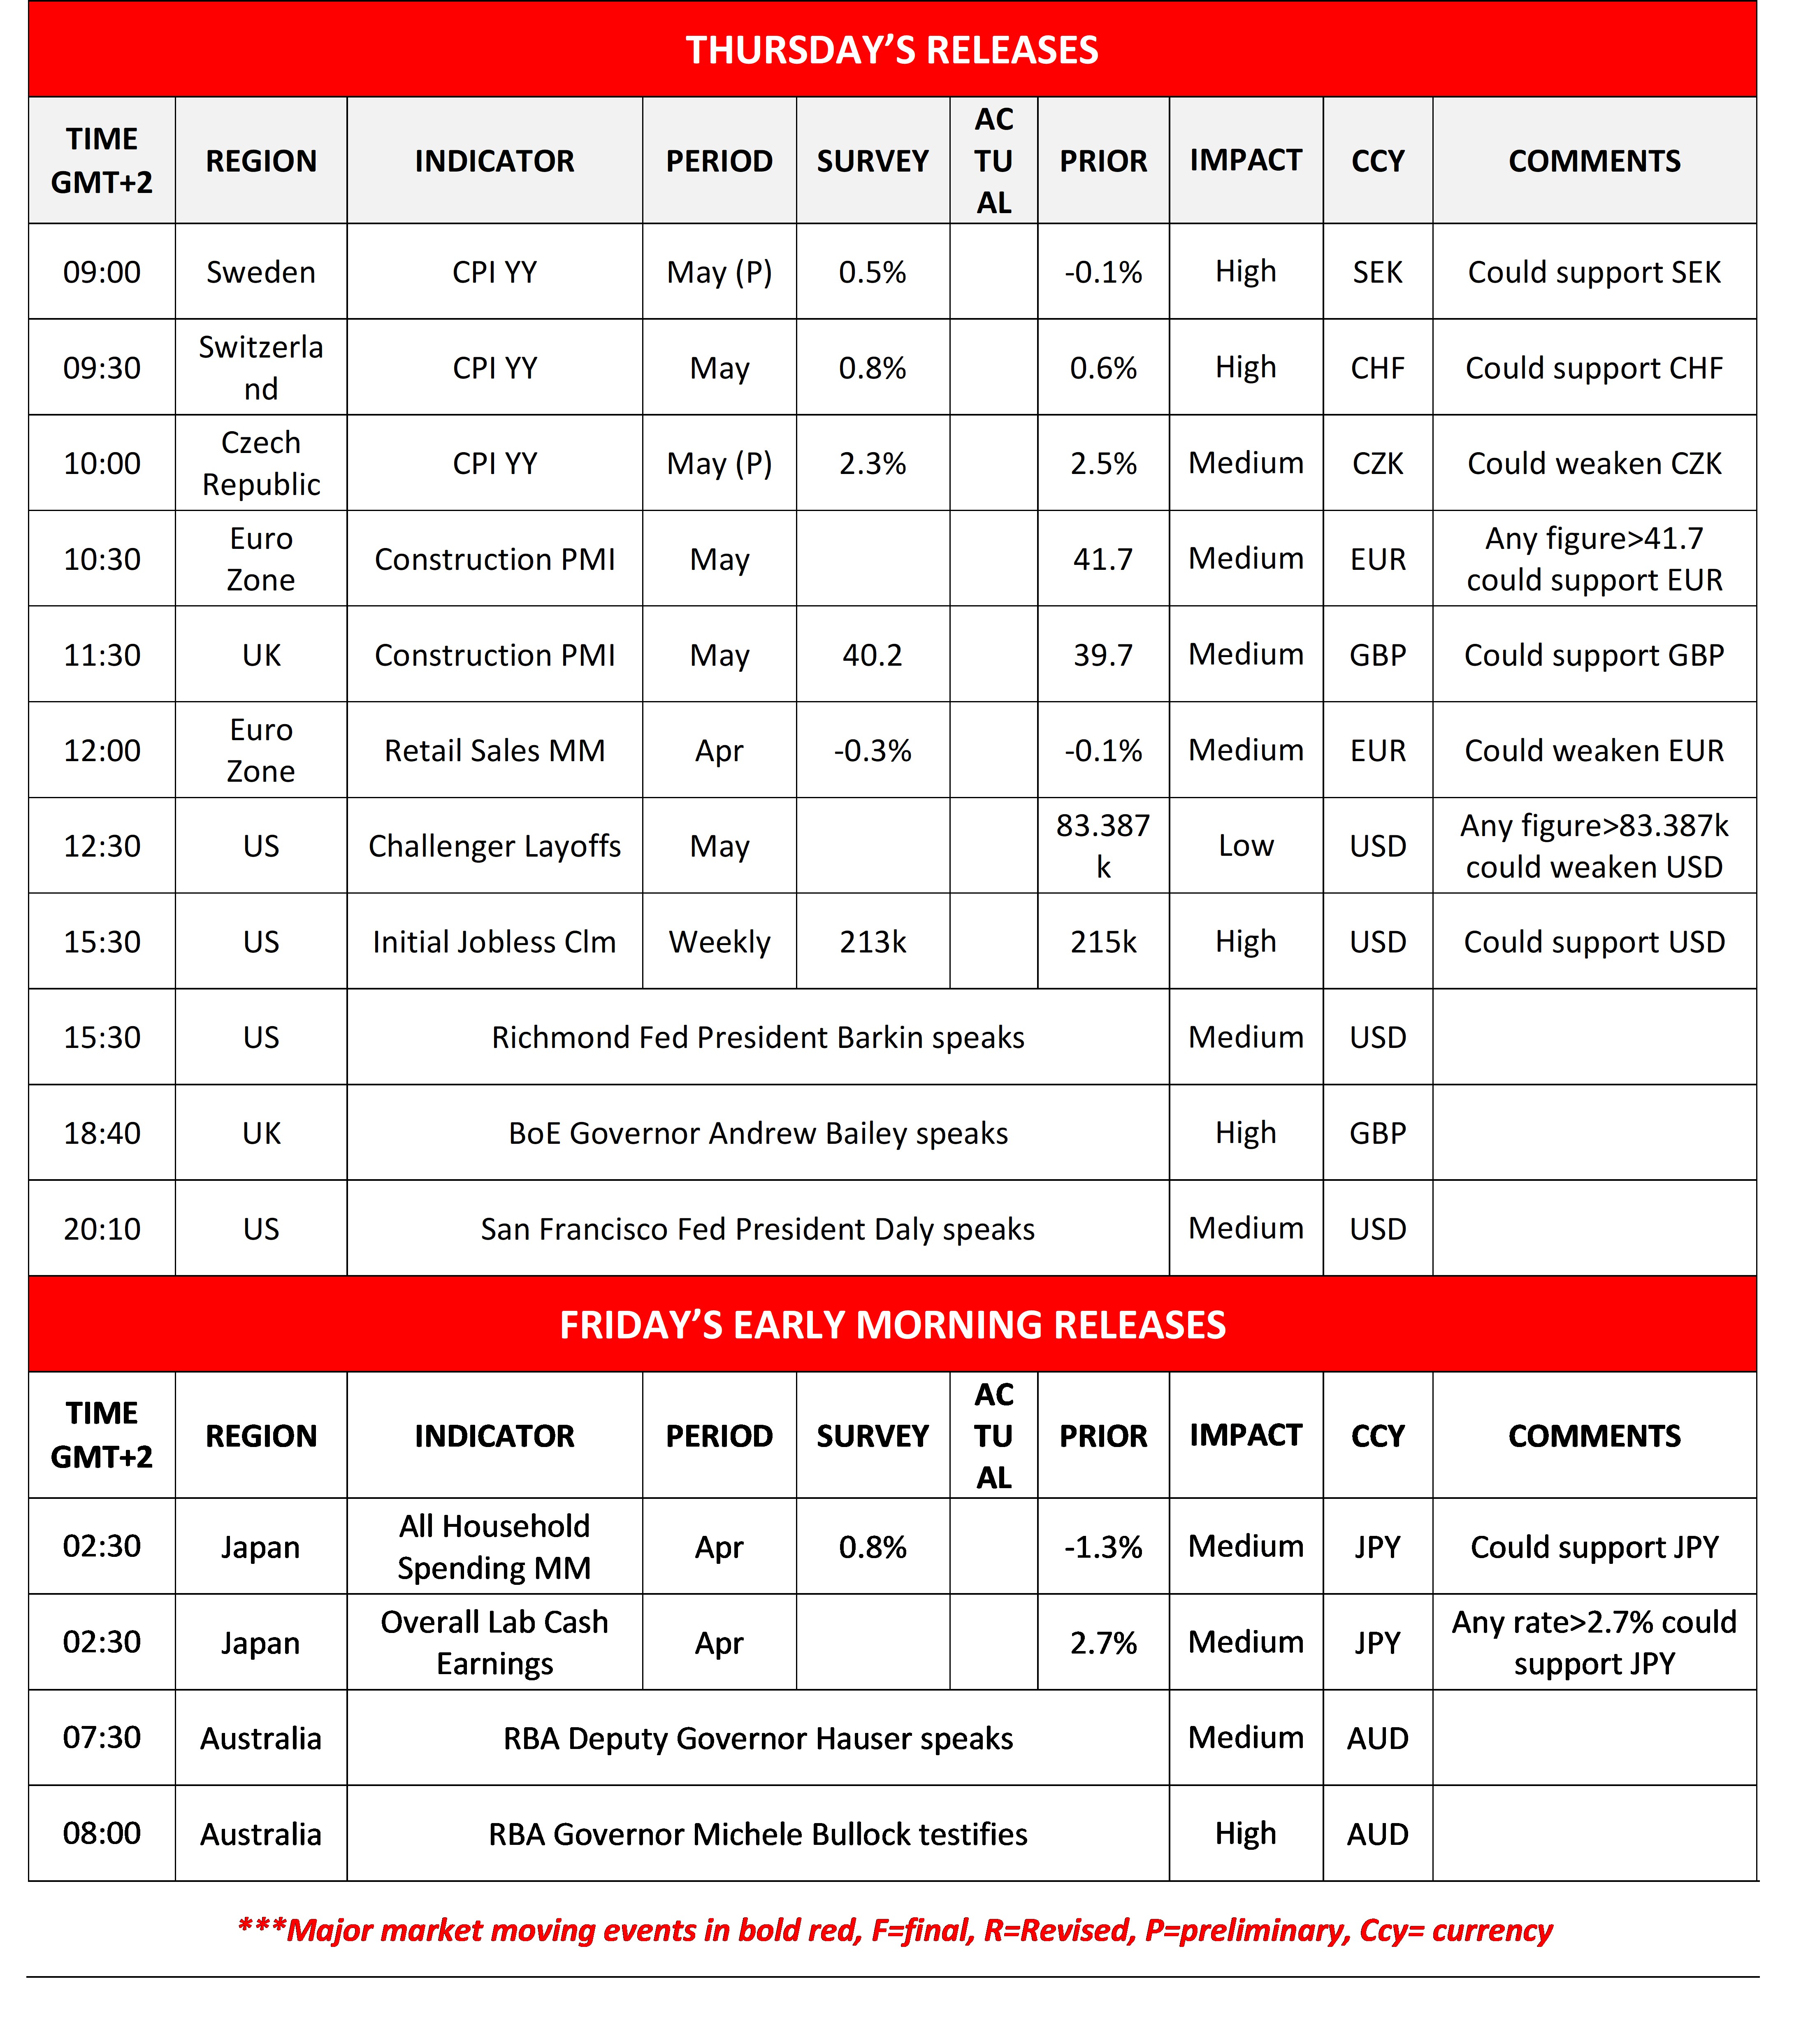
Today we get Sweden’s, Switzerland’s and the Czech Republic’s CPI rates for May, The Euro Zone’s and the UK’s construction PMI figures for May and from the US the Challenger layoffs figure for May and the weekly initial jobless claims figure.
We also note that Richmond Fed President Barkin, BoE Governor Andrew Bailey and San Francisco Fed President Daly speak.
In tomorrow’s Asian session we get Japan’s All household spending and Labour Cash Earnings both for April, while RBA’s Hauser and Governor Michele Bullock speak.
Charts to keep an eye out
USD/CAD
USD/CAD continued to rise breaking the 1.3880 (S1) resistance line, now turned to support.
We maintain our bullish outlook for the pair as long as the upward trendline guiding it remains intact.
Yet note that the RSI indicator has reached the reading of 70, implying a strong bullish market sentiment for the pair but also that the pair has neared overbought levels and may be ripe for a correction lower.
Similar signals stem from the price action teasing the upper Bollinger band. Should the bulls maintain control as expected we may see the pair aiming for the 1.4020 (R1) line.
Should the bears take over, USD/CAD may reverse its course breaking the 1.3880 (S1) line, break also the prementioned upward trendline and aim for the 1.3730 (S2) support level.
Dow Jones
Dow Jones corrected lower yesterday nearing the 50500 (S1) support line. Despite dropping, the upward trendline guiding it remained intact and the RSI indicator managed to remain in bullish territory.
We maintain our bullish outlook for the time being and treat the drop as a correction. Should the bulls remain in charge as expected, we may see Dow Jones’ price action aiming if not breaking the 51500 (R1) resistance line once again.
Should the bears take over, we may see the Dow Jones, breaking the 50500 (S1) line, breaking also the prementioned upward trendline and continue to aim for the 49600 (S2) support level.
USD/CAD Daily Chart
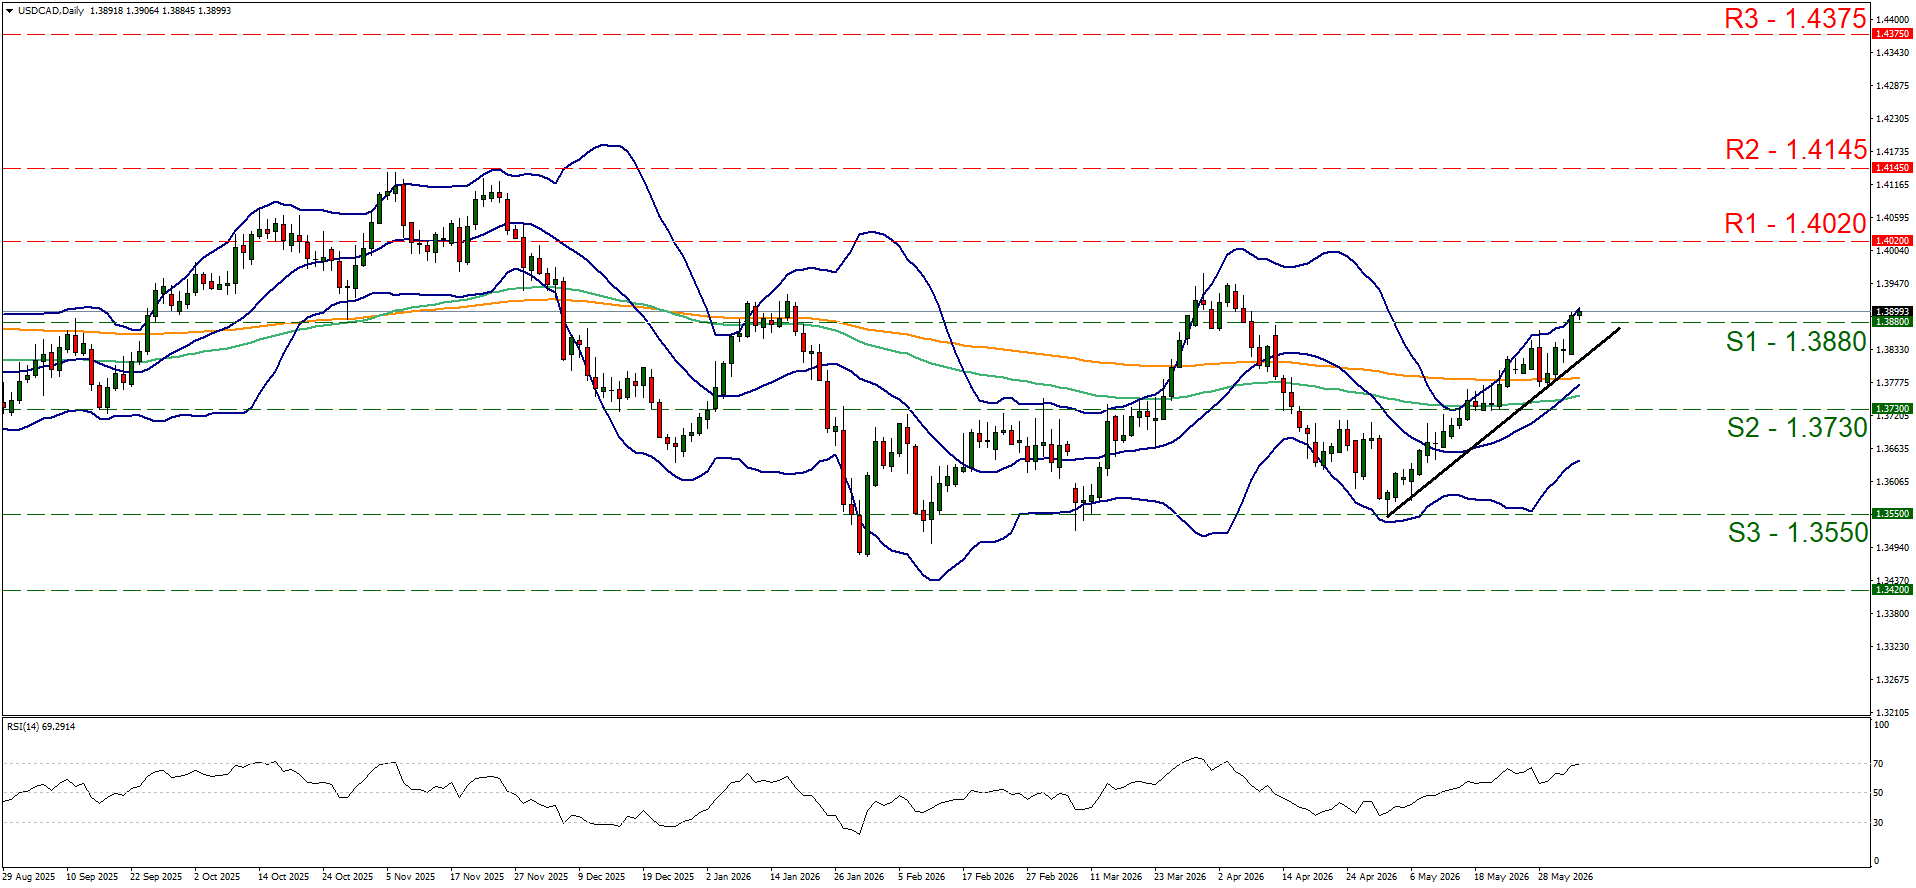
- Support: 1.3880 (S1), 1.3730 (S2), 1.3550 (S3)
- Resistance: 1.4020 (R1), 1.4145 (R2), 1.4375 (R3)
US30 Cash Daily Chart
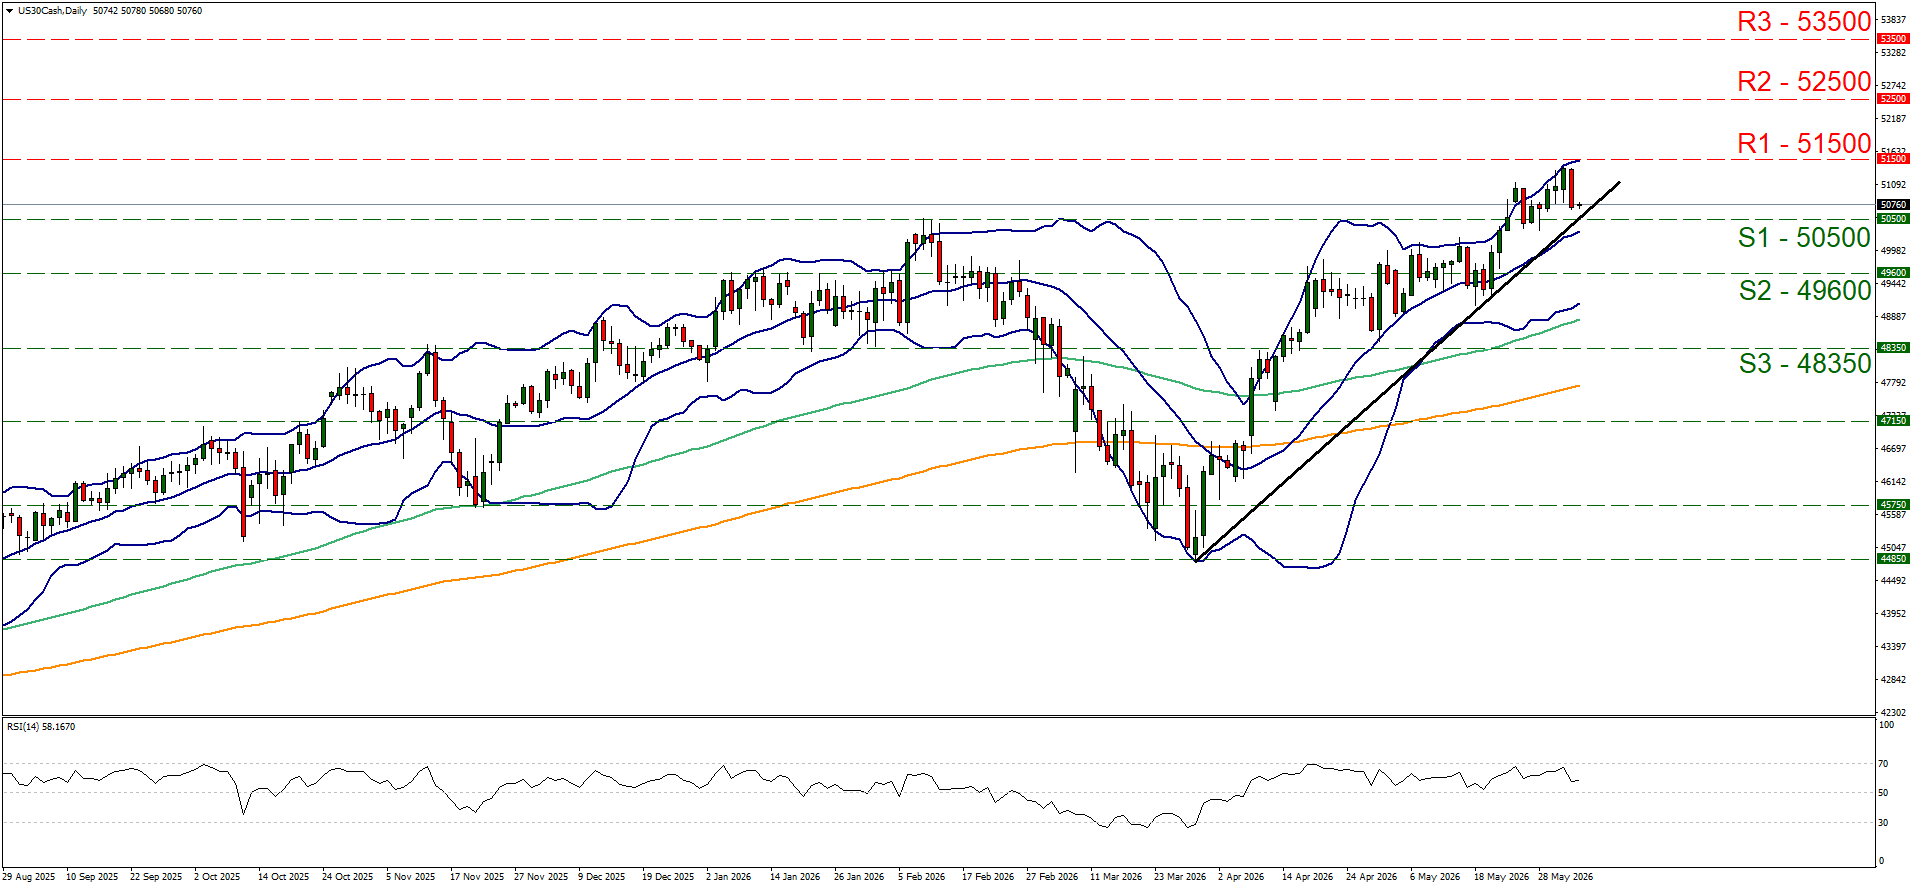
- Support: 50500 (S1), 49600 (S2), 48350 (S3)
- Resistance: 51500 (R1), 52500 (R2), 53500 (R3)
إخلاء المسؤولية:
لا تُعد هذه المعلومات نصيحة استثمارية أو توصية بالاستثمار، وإنما تُعد تواصلاً تسويقيًا. لا تتحمل IronFX أي مسؤولية عن أي بيانات أو معلومات مقدمة من أطراف ثالثة تم الإشارة إليها أو الارتباط بها في هذا التواصل.