 FR
FR  EN
EN  ES
ES  KO
KO  PT
PT  ZH
ZH  AR
AR  FA
FA  RU
RU  NL
NL  MS
MS  VI
VI  PH
PH  TH
TH  ID
ID 

Hawkish expectations for the Fed lift the USD
The greenback, despite a bad start yesterday, managed to rebound in the American session. Market expectations for the Fed to remain hawkish in its meeting tomorrow were supportive for the US dollar. On the other hand, easing market worries about the situation in the Middle East tend to calm the market’s nerves about inflationary pressures in the US economy and reduce safe-haven inflows for the USD. Hence, besides the market’s expectations for the Fed’s intentions, we also highlight the developments in the Middle East as a possible market mover for the greenback.
Wall Street ends lower on AI worries
Wall Street ended lower yesterday with all three major US equity indexes dropping, with some hesitation by Dow Jones. The market worries created by the earnings releases of Tesla and Alphabet have intensified the market’s attention for earnings releases by major technology companies this week, as mentioned in yesterday’s report. Market worries for possible overspending in the AI sector tend to create bearish tendencies for the sector. Also, hawkish expectations for the Fed tomorrow could weigh on US equities.
Bearish pressures on oil prices continue
Bearish tendencies continue to be exercised on oil prices as the US and Iran continue to extend the pause in airstrikes. Market hopes for the negotiating process have been lifted, given also US President Trump’s comment that the US is having “good talks” with Iran were in a positive direction. Nevertheless, the situation is particularly fragile and as US President Trump stated US airstrikes would resume should negotiations fall through, while similar signals came from Iran. Should we see market hopes for the negotiations process intensifying, we may see oil prices retreating further and vice versa.
Bitcoin shows bearish pressures
The Fed’s hawkish intentions, the market worries for overspending in AI and an elusive institutional demand for the crypto market seem to have created a cautious crypto market approach. Bitcoin’s price has been on the retreat and should the crypto market’s worries intensify we may see it dropping even lower.
Autres points forts pour aujourd'hui
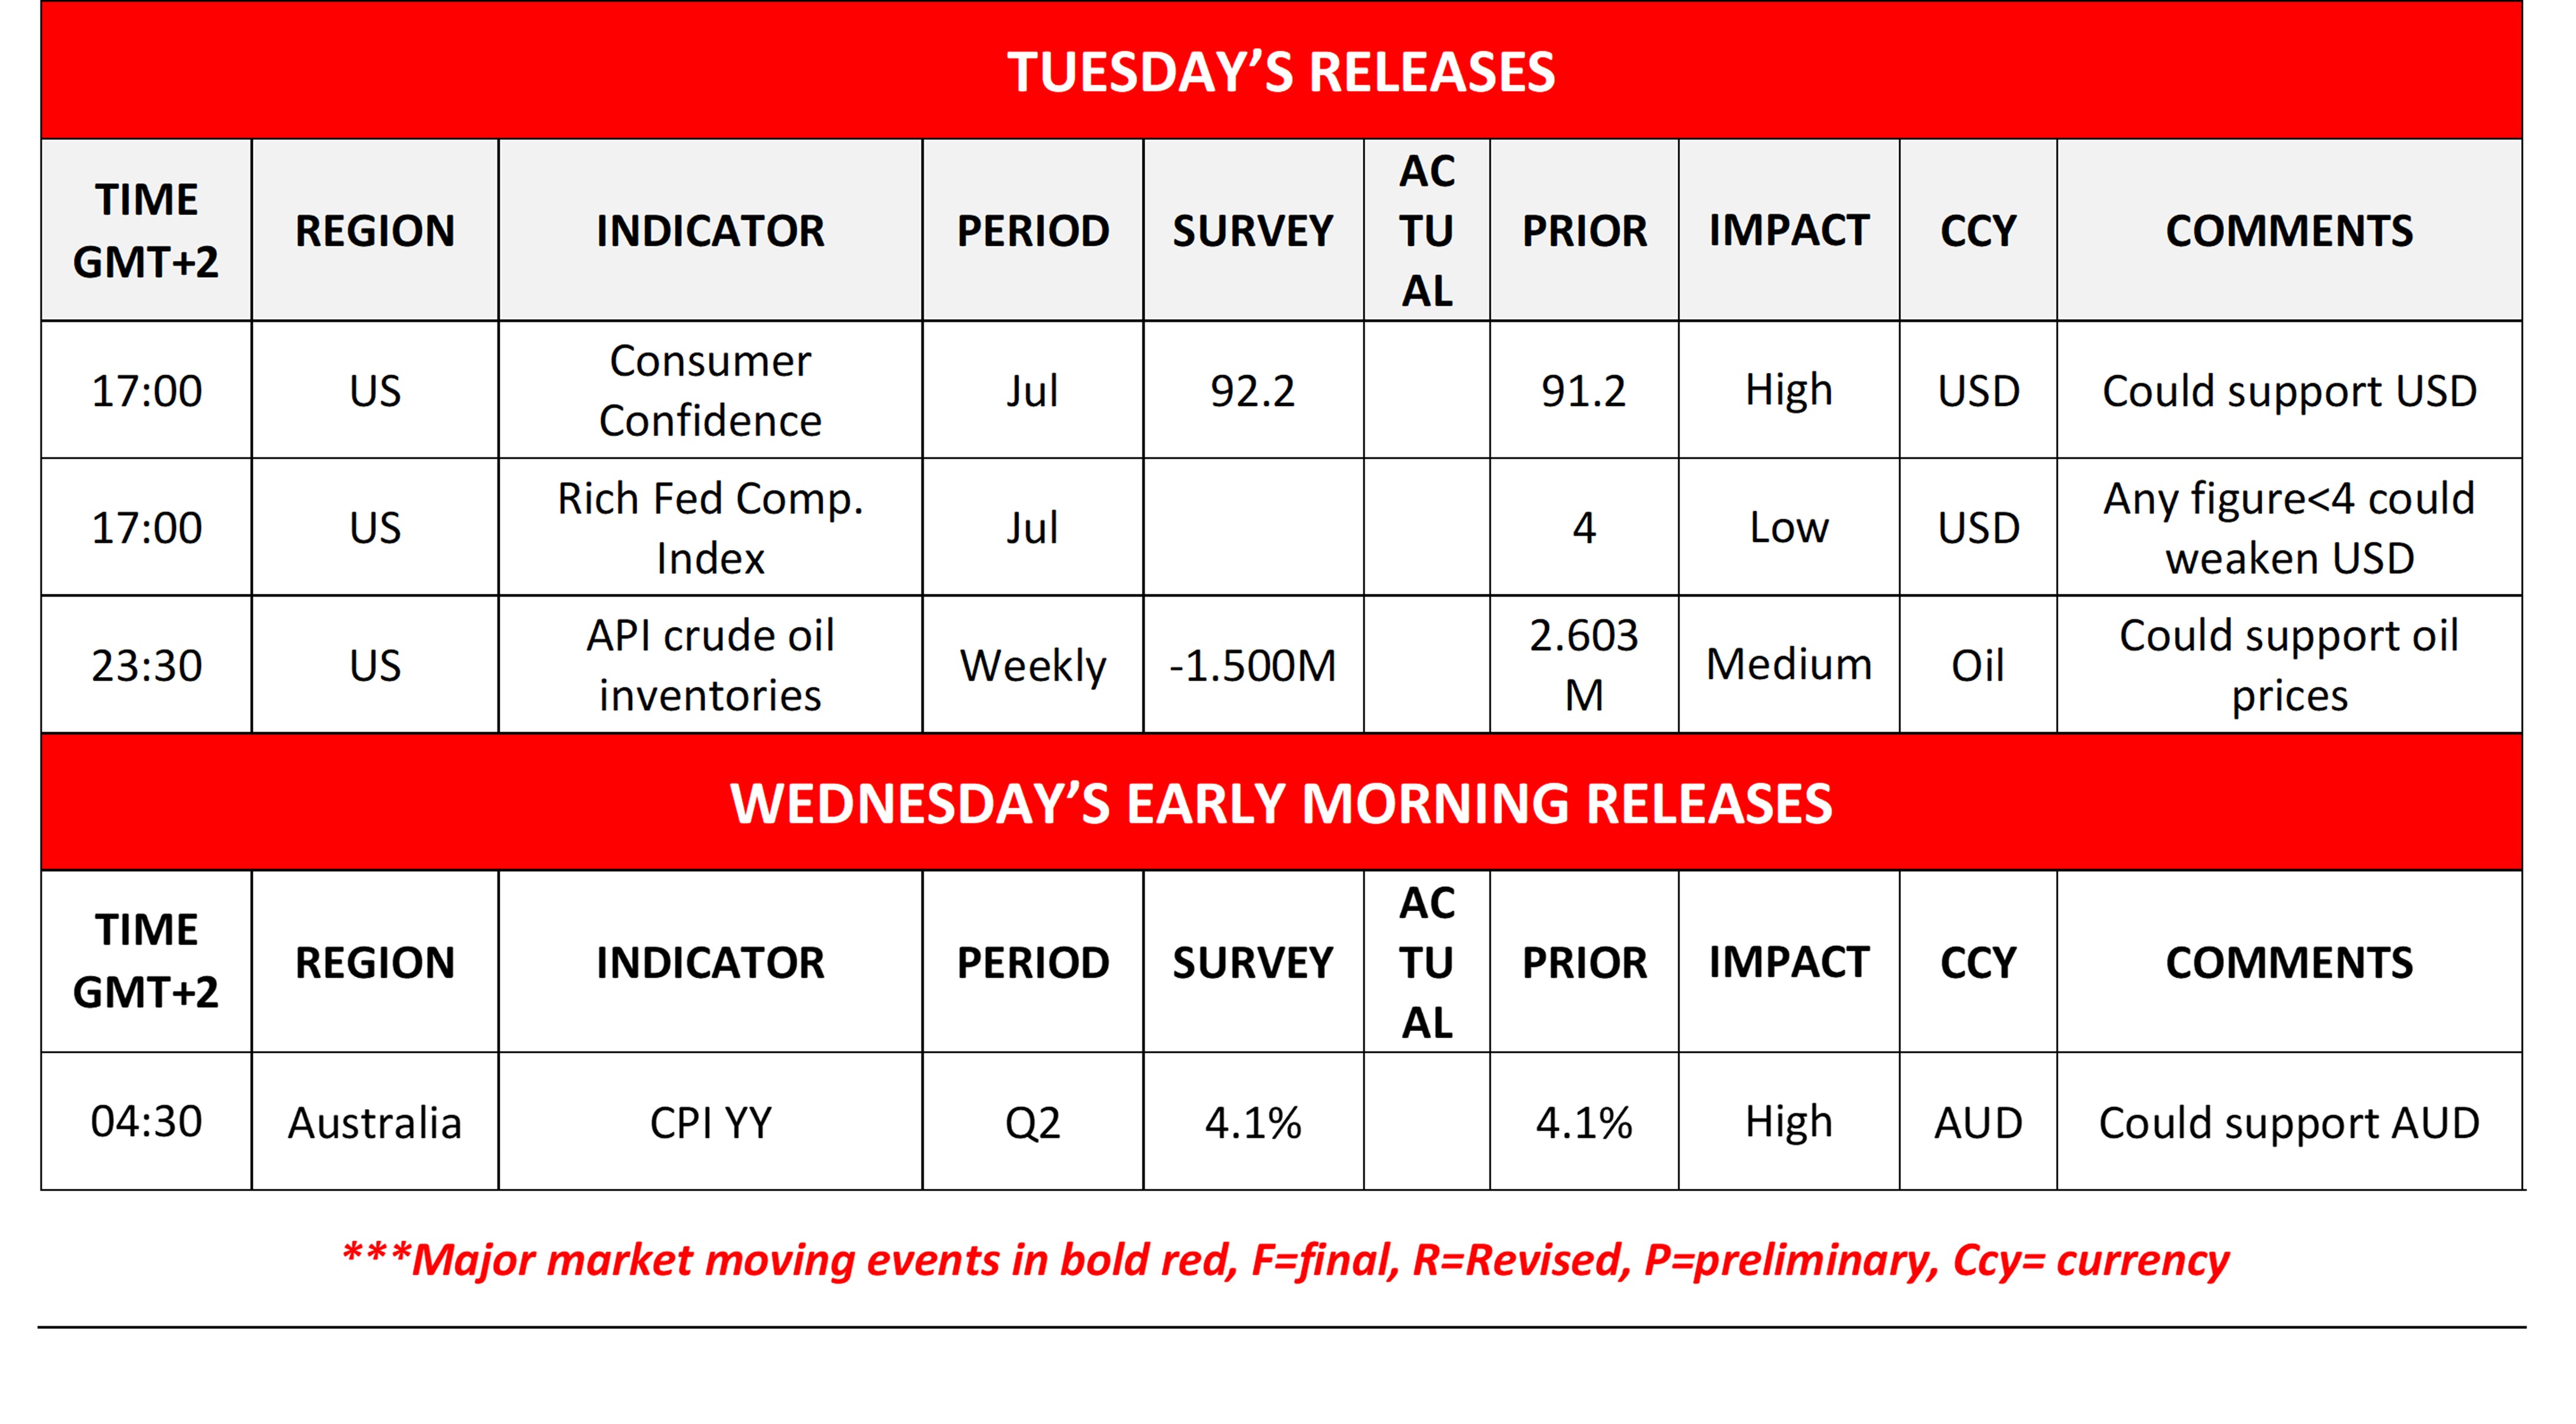
Today we get from the US, July’s consumer confidence, the Richmond Fed indexes for July and later the weekly API crude oil inventories figure.
Charts to keep an eye out
Given the release of Australia’s CPI rates tomorrow, we shift our attention on a technical level towards AUD/USD. The pair remains in a tight sideways motion just above the 0.6960 (S1) support line currently. We maintain our bias for the sideways motion continue currently given also that the Bollinger bands are narrowing and the RSI indicator runs along the reading of 50, implying a rather neutral market sentiment. Should the bears take over, AUD/USD may break the 0.6960 (S1) support line and aim for the 0.6830 (S2) support level. Should the bulls get in charge, AUD/USD may aim if not reach the 0.7585 (R2) resistance base.
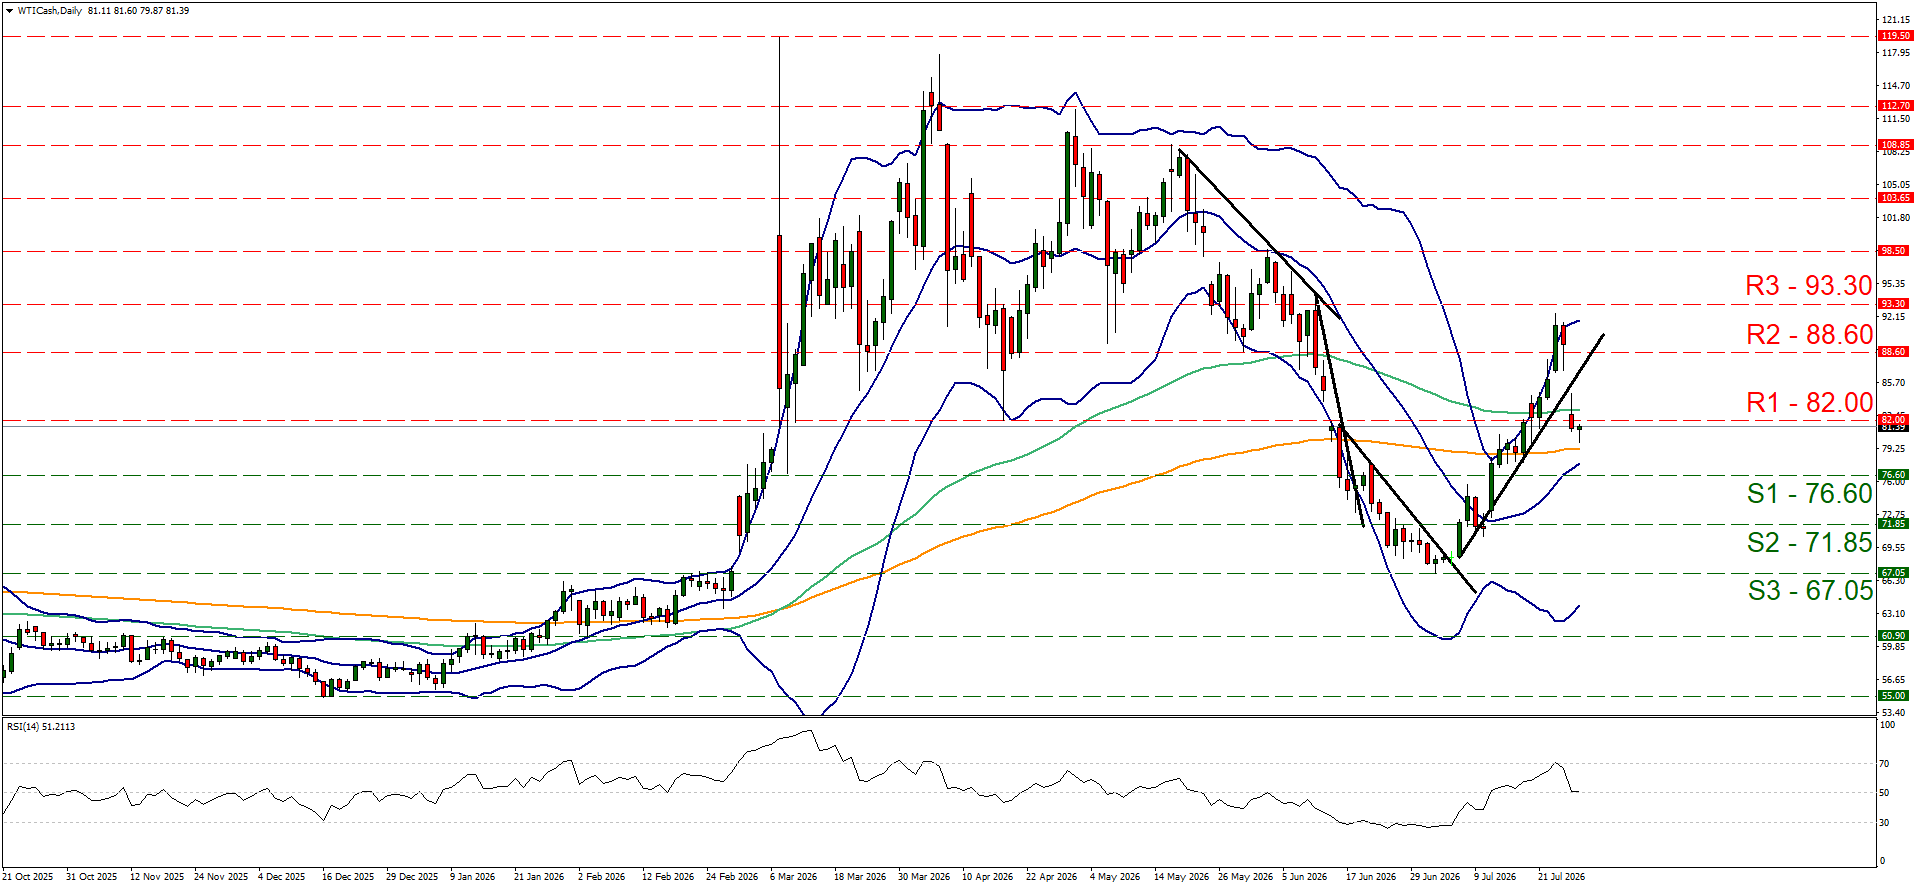
WTI’s price continued to drop yesterday breaking the 82.00 (R1) support line, now turned to resistance. The price action has temporarily halted its drop, allowing for the RSI indicator to stabilise around 50, implying a rather indecisive market. Yet we expect the downward motion to continue and should the bears continue to lead the commodity’s direction we may see WTI’s price breaking the 76.60 (S1) support line, paving the way for the 71.85 (S2) support level. Should the bulls take over, which seems as a remote scenario currently, we may see WTI’s price action breaking the 82.60 (R1) resistance line and start aiming for the 88.60 (R2) resistance level.
AUD/USD Graphique H4
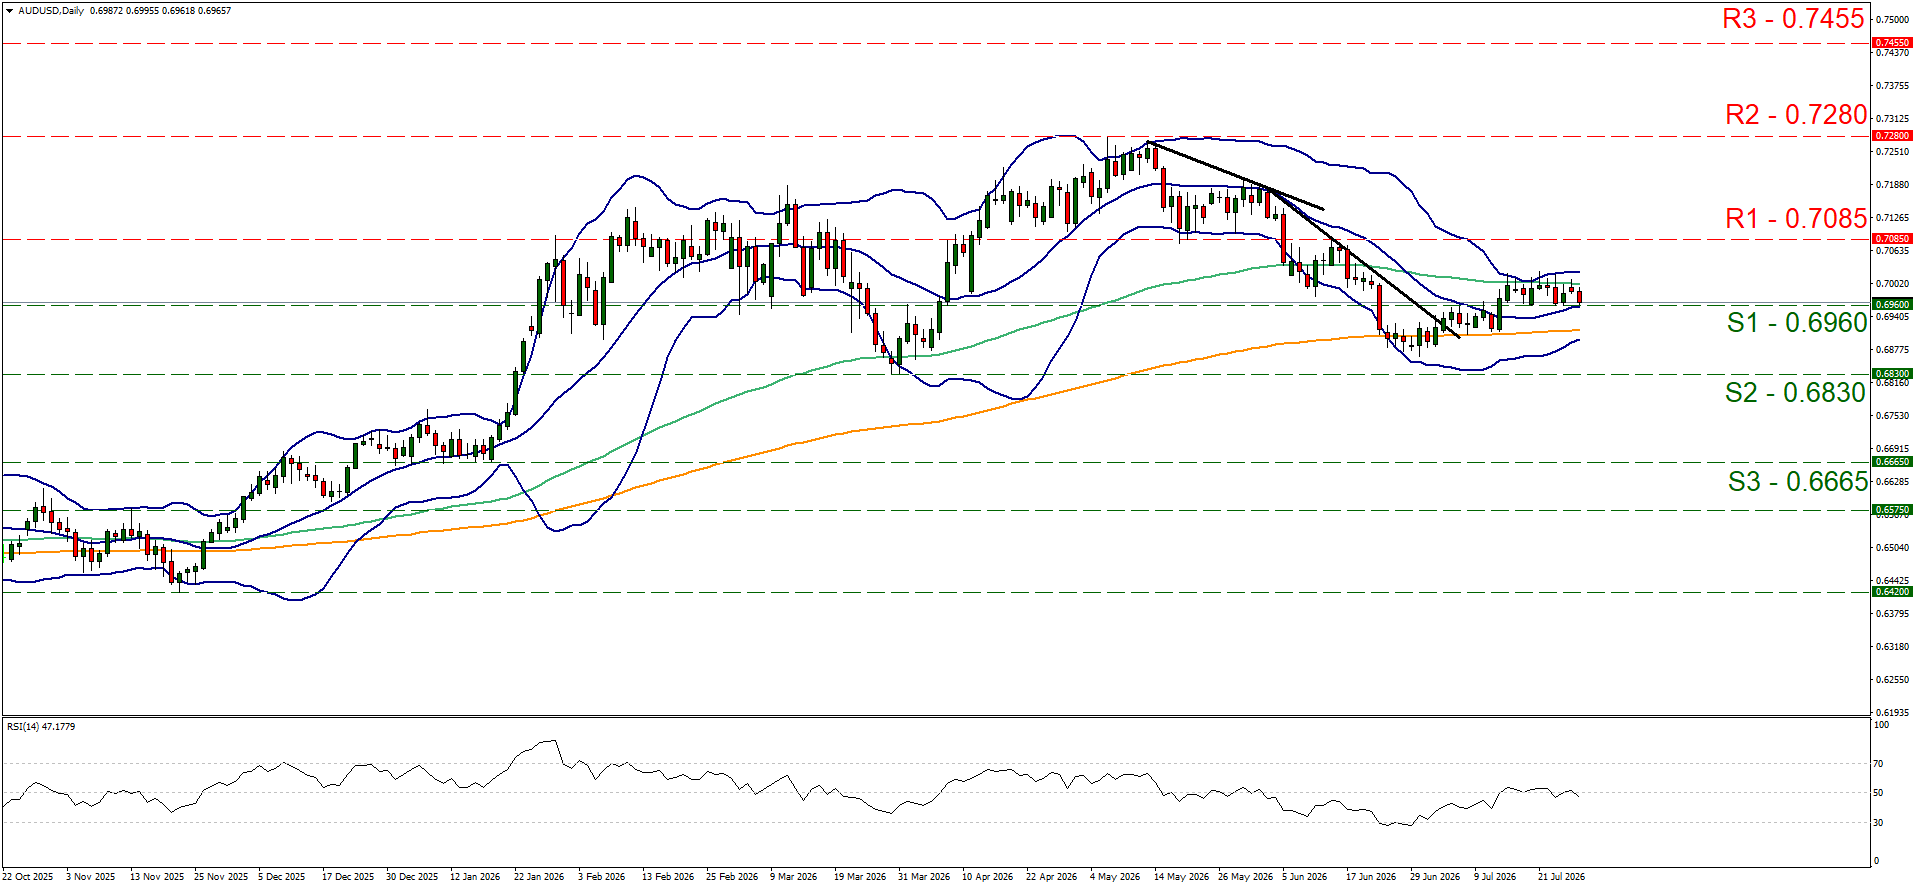
- Support: 0.6960 (S1), 0.6830 (S2), 0.6665 (S3)
- Resistance: 0.7085 (R1), 0.7280 (R2), 0.7455 (R3)
WTI Daily Chart
- Support: 0.6960 (S1), 0.6830 (S2), 0.6665 (S3)
- Resistance: 0.7085 (R1), 0.7280 (R2), 0.7455 (R3)
Avertissement :
Ces informations ne doivent pas être considérées comme un conseil ou une recommandation d'investissement, mais uniquement comme une communication marketing. IronFX n'est pas responsable des données ou informations fournies par des tiers référencés, ou en lien hypertexte, dans cette communication.


