

US stock markets seem to have edged higher since our last report as all three major US stock market indexes, Dow Jones, S&P 500 and Nasdaq, edged higher,. In this report, we are to discuss some fundamental issues and continue to have a look at the Fed’s interest rate decision and Apple’s most recent announcement and finish off the report wit a technical analysis of Dow Jones’ daily chart
FOMC Interest rate decision
The Fed’s interest rate decision is set to occur during today’s American session. The current expectations by market participants are for the bank to remain on hold, with Fed Fund Futures currently implying a 99% probability for such a scenario to occur. Therefore, our attention now turns to the bank’s accompanying statement, in addition to the post-decision press conference by Fed Chair Powell. In the event that Fed policymakers appear to be predominantly hawkish in nature, i.e implying that interest rates may need to remain higher for longer, and thus pushing back against the market’s current expectations of a rate cut in the bank’s November meeting, it could provide support for the greenback whilst weighing on the US Equities markets and vice versa. On another note, the Fed’s revised dot plot is set to be released alongside the Fed’s interest rate decision. The dot plot is essentially the forecasts made by Fed policymakers for where they believe interest rates will be further down the line. Therefore, should the dot plot be revised higher i.e implying interest rates remaining higher for longer and thus fewer expected rate cuts in the near future, it could support the dollar whilst weighing on the US Equities markets. On the flip side, should the dot plot indicate more rate cuts than what is currently anticipated by market participants, it could weigh on the dollar, whilst providing support for US Equities.
Apple (#AAPL) announces AI integration
Apple’s Worldwide Developer Conference on Monday appears to have been a resounding success, with Apple’s (#AAPL) stock price reaching a new record high in the week. The highlight of the conference was when Apple unveiled for the first time, its vision for the integration between its products and artificial intelligence. In particular, Apple unveiled its “Apple Intelligence”, in which Apple’s operating system will be integrated with OpenAI’s ChatGPT, allowing the company to enter the generative AI space. Moreover, it appears that Apple (#AAPL) has decided to make user data privacy, the core of its pitch. Specifically, Apple has stressed that many AI features will work-on-device, essentially being processed locally, when that’s possible, and in instances where more cloud computing power is required, it will run through what the company calls its “Private cloud compute”. The “Private cloud compute”, or PCC as we like to call it, are essentially servers which are powered by Apple’s silicon chip , which will be used to process more complicated requests which cannot be done “on-device”. Moreover, in order to ensure that the company will never be able to store or access the data on the servers, they will be ‘audited’ by independent experts who will inspect the code in order to verify the aforementioned privacy claims. Overall, the announcement appears to have been well-received by market participants with the company’s stock price moving higher, as the new developments could increase future sales and thus potentially increasing revenue for the company, which may aid the company’s stock price in the long run.
Analisis Teknikal
US30 Daily Chart
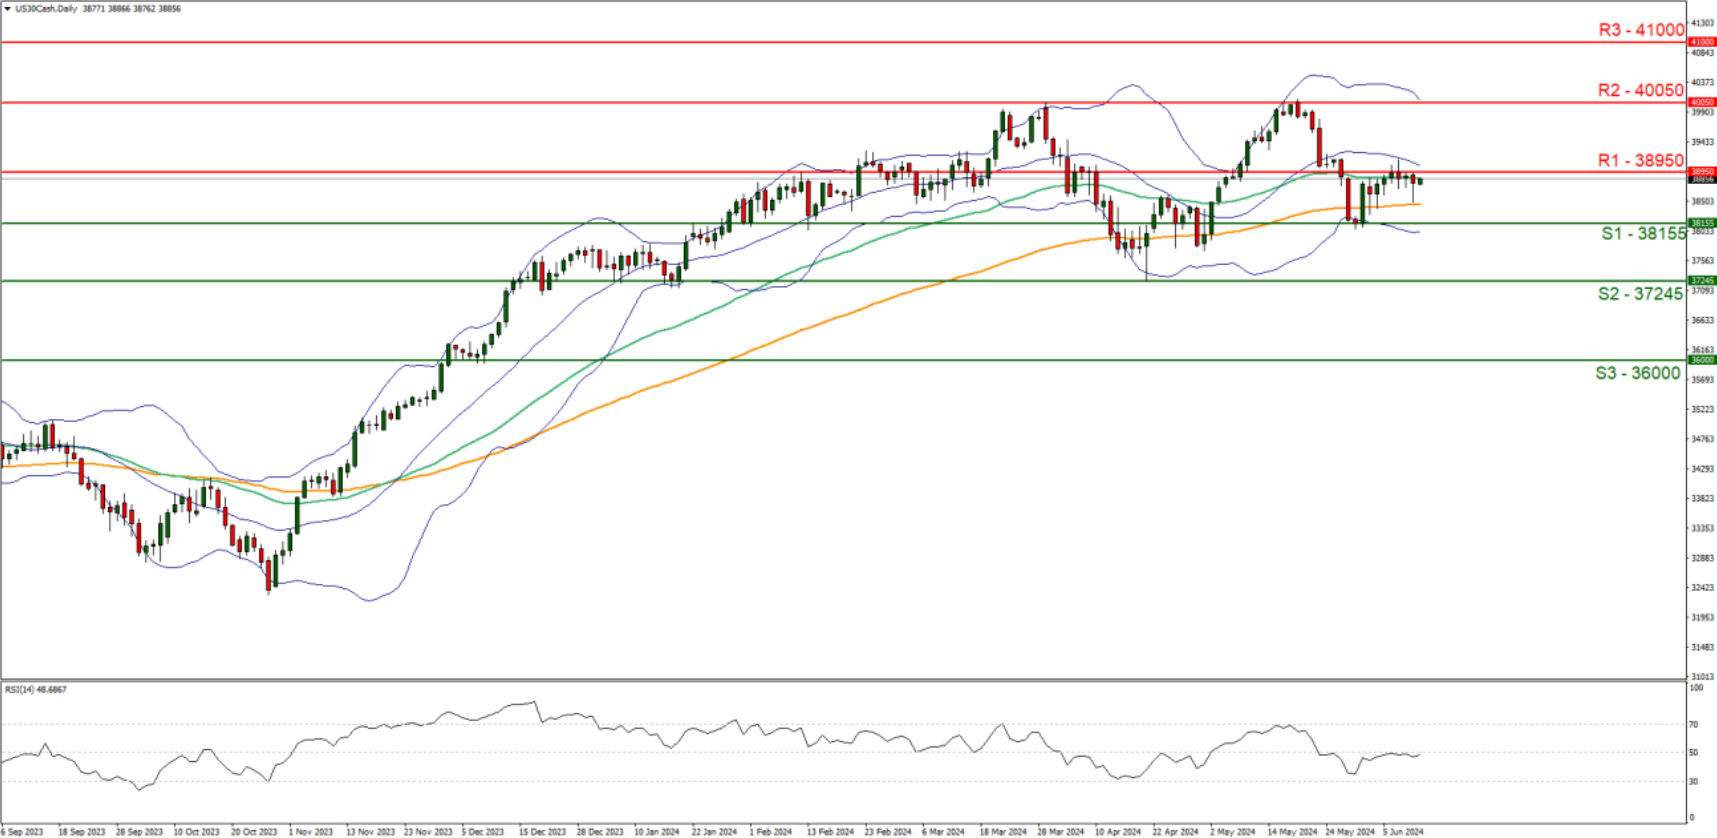
- Support: 38155 (S1), 37245 (S2), 36000 (S3)
- Resistance: 38950 (R1), 40050 (R2), 41000 (R3)
US30 edged slightly higher since our last report. We opt for a sideways bias for the index and supporting our case is the RSI indicator below our chart which currently registers a figure near 50, implying a neutral market sentiment, in addition to the 50 and 100 moving averages appearing to be flattening out. For our sideways bias to continue, we would require the index to remain confined between the sideways moving channel defined by the 38155 (S1) support line and the 38950 (R1) resistance line. On the flip side for a bullish outlook, we would require a clear break above the 38950 (R1) resistance line with the next possible target for the bulls being the 400050 (R2) resistance level. Lastly, for a bearish outlook we would require a clear break below the 38155 (S1) support line with the next possible target for the bears being the 37245 (S2) support level
If you have any general queries or comments relating to this article please send an email directly to our Research team at research_team@ironfx.com
Disclaimer:
This information is not considered as investment advice or an investment recommendation, but instead a marketing communication. IronFX is not responsible for any data or information provided by third parties referenced, or hyperlinked, in this communication.


