
US equity markets are back in focus after the long weekend, with investors closely monitoring developments in US-Iran relations, movements in oil prices, and expectations surrounding the Federal Reserve’s monetary policy path.
While improving geopolitical sentiment may support risk appetite, concerns over higher interest rates continue to influence market direction.
USD steadies in the FX market
After a long weekend, the dollar tended to hold steady in today’s Asian session. No high impact financial releases are expected from the US today, hence we expect fundamentals to lead the greenback.
A more risk on approach by the markets could weigh on the USD and vice versa. In the Far East, JPY continued to weaken against the USD, intensifying worries for a possible market intervention operation from Japan to the Yen’s rescue.
Also in Europe, the GBP opened lower today, as political uncertainty is on the horizon, given the possibility of UK PM Starmer resigning.
Loonie traders focusing on May’s CPI rates
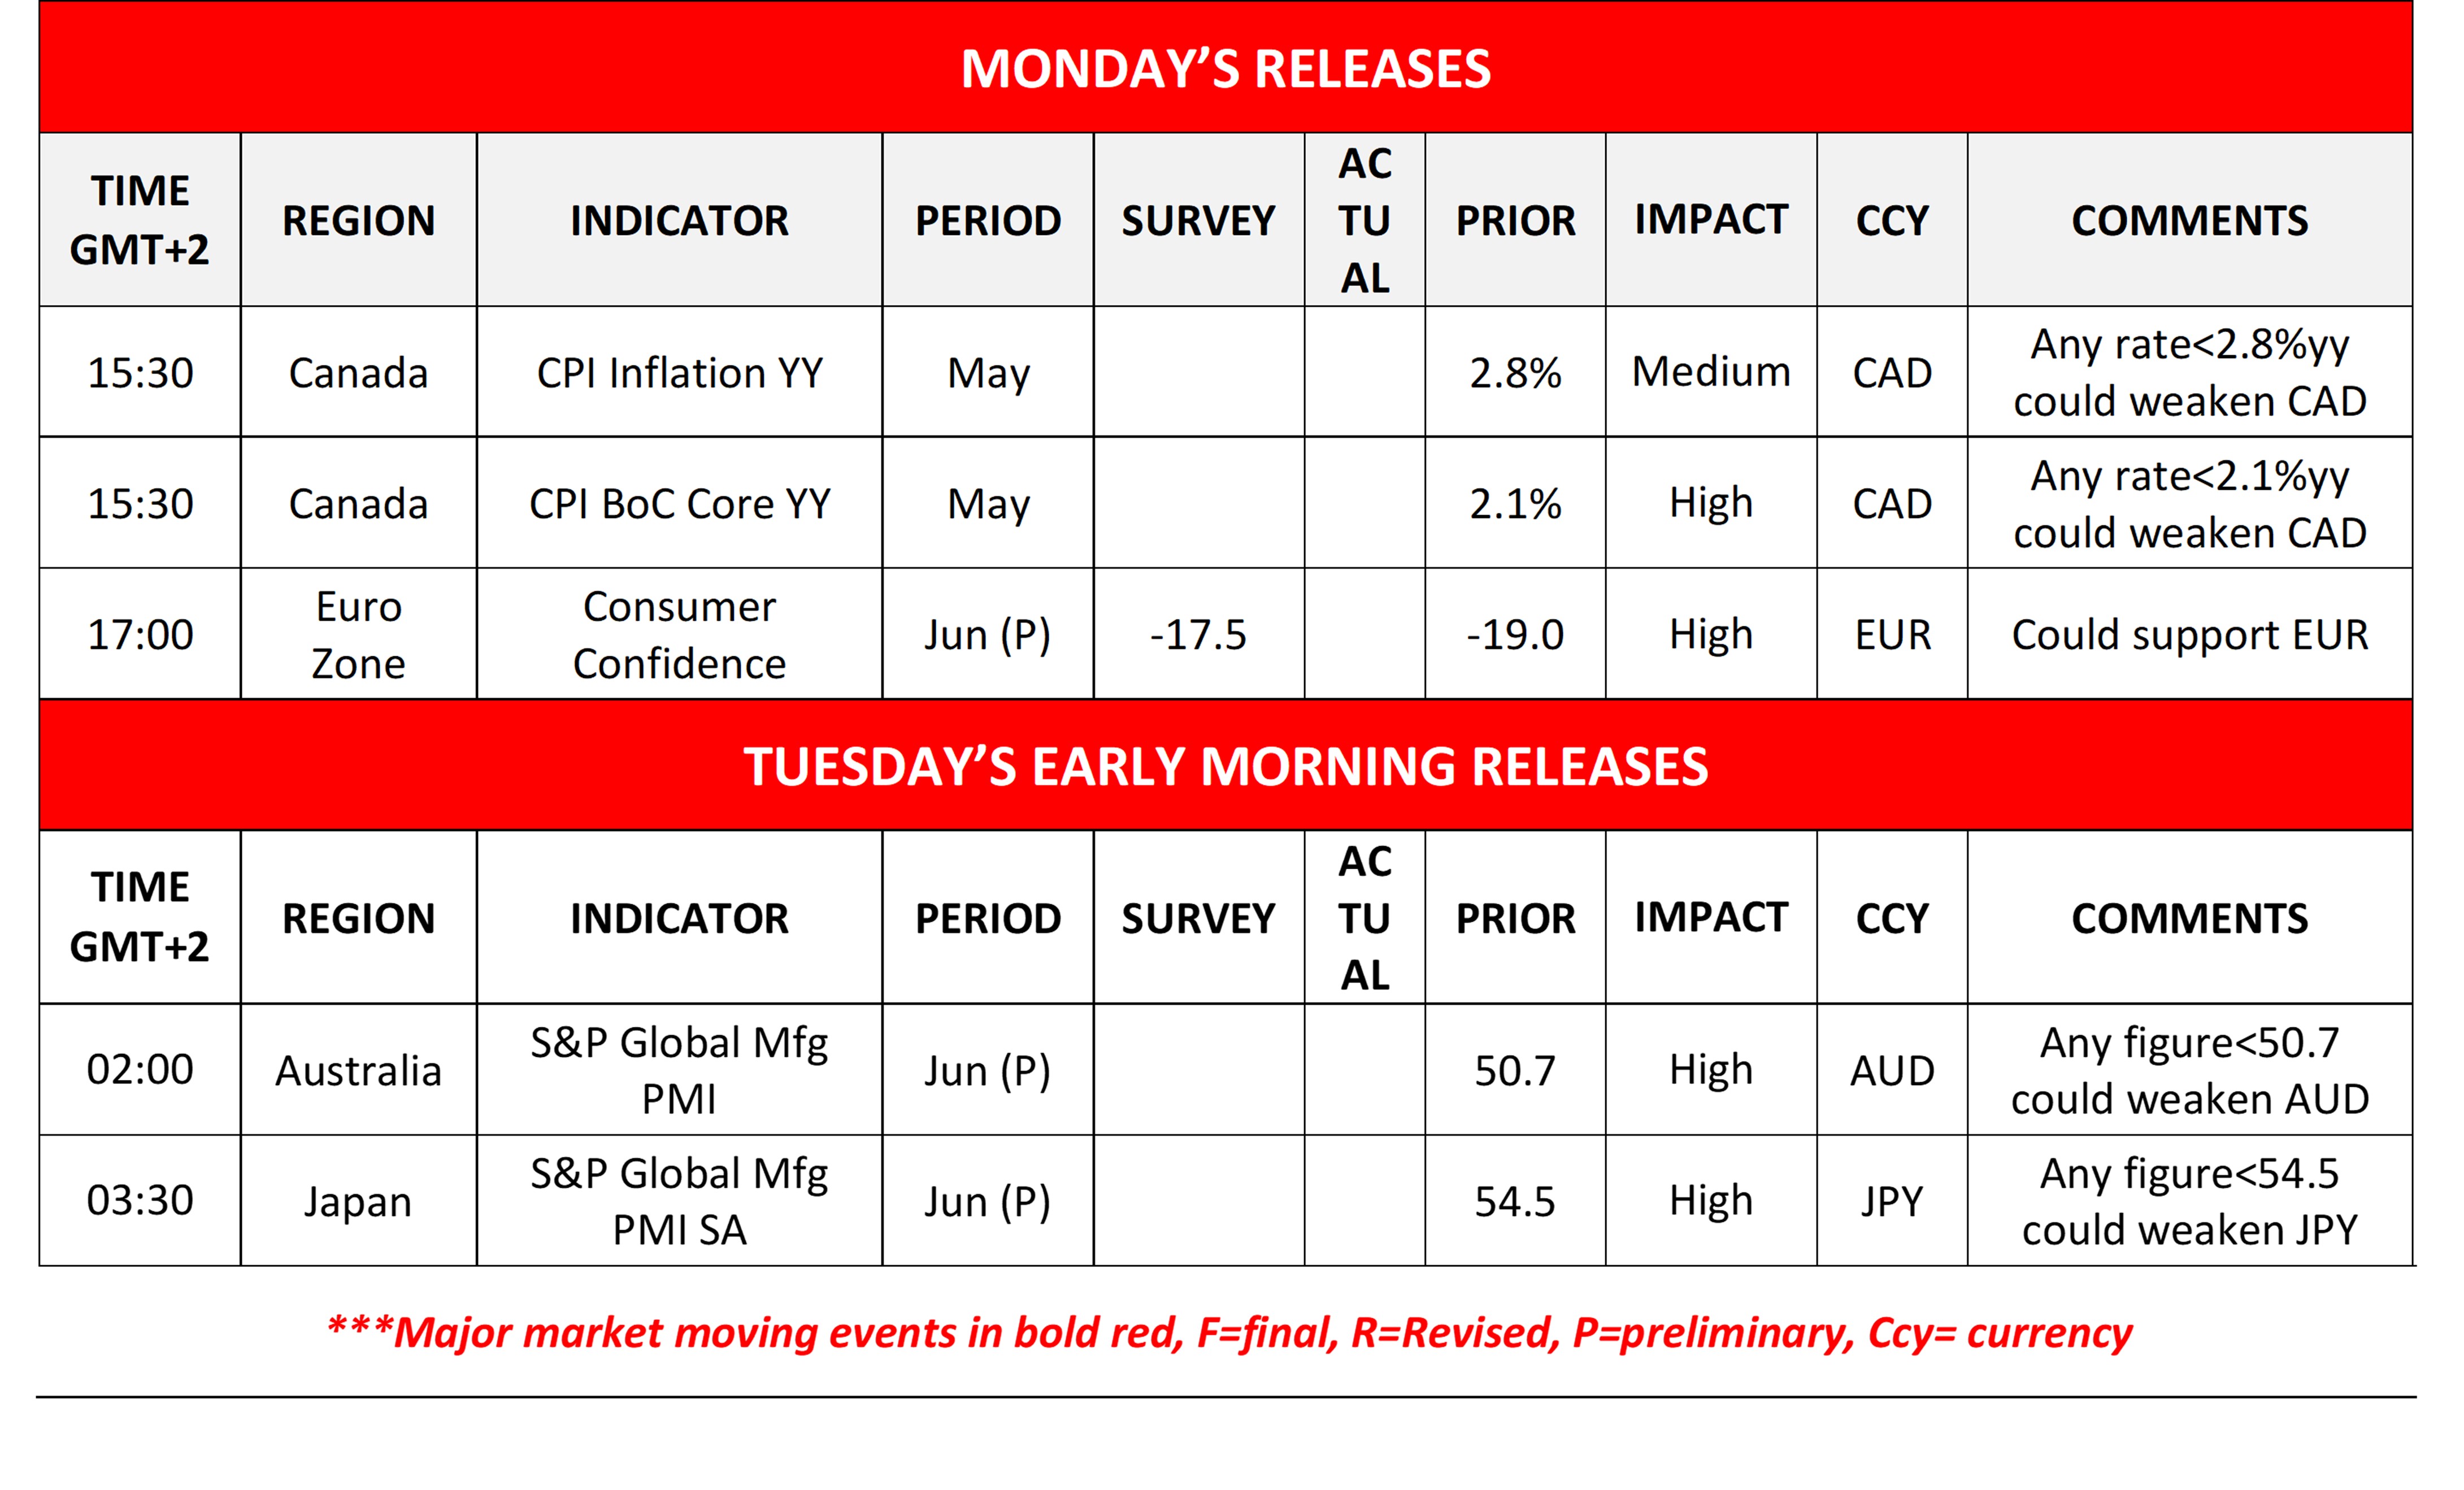
North of the US border, Loonie traders are focusing on the release of Canada’s CPI rates for May in today’s early American session.
Please note that the CAD continued to weaken against the USD given also a wider deceleration of the retail sales growth rate for May released on Friday. The CPI rates are expected to accelerate and a possibly wider than expected acceleration could provide some support for the CAD.
Oil prices drop as Iran-US negotiations end their first round
Oil prices dropped in today’s Asian session as the US and Iran concluded the first round of negotiations. Iran seems to have secured waivers for oil exports, which eases market worries for the supply lines of the oil market.
Despite the fragility of the situation, we remain optimistic and a possible further improvement of the oil market sentiment could drive oil prices even lower.
US equity markets restart their engines after the long weekend
US equity markets are to reopen after the long weekend, given the Juneteenth public holiday on Friday.
On the one hand, market expectations for an improvement of the US-Iran relationships and a normalisation of the oil market supply chains tend to provide improve the market sentiment.
On the other, market worries for a possible tightening of the Fed’s monetary policy tend to weigh on US equities.
Other highlights for today
Today we get Euro Zone’s preliminary June Consumer Confidence. In tomorrow’s Asian session, we get Australia’s and Japan’s preliminary PMI figures for June.
As for the rest of the week
On Tuesday we get Germany’s, France’s, the Euro Zone’s, the UK and the US preliminary PMI figures for June and on Wednesday we get Australia’s CPI rates for May and Germany’s Ifo indicators for June.
On Thursday we get Australia’s employment data for May, the US PCE rates for May, the US final GDP rate for Q1 and the US weekly initial jobless claims figure. On Friday we get from Japan, Tokyo’s CPI rates for June and the final US UoM consumer Sentiment.
Charts to keep an eye out
USD/CAD
USD/CAD continued to rise breaking the 1.4145 (S1) resistance line. We maintain a bullish outlook, expressed in our last report, yet highlight that the pair has reached overbought levels and may correct lower.
It’s characteristic that the RSI indicator has risen substantially above the reading of 70 and the price action is flirting with the upper Bollinger band.
Should the bulls remain in the driver’s seat, we may see the USD/CAD aiming if not breaching the 1.4245 (R1) resistance line. For a bearish outlook to emerge we would require USD/CAD to breach the 1.4145 (S1) support line, the upward trendline and the 1.4020 (S2) support level.
WTI
WTI’s price edged lower in today’s Asian session, remaining below the 76.60 (R1) resistance line. The RSI indicator remains near the reading of 30, implying a continuance of the strong bearish market sentiment for WTI’s price.
Should the bears remain in control, WTI’s price may start aiming for the 69.00 (S1) support line. While for a bullish outlook, we would require WTI’s price to break the 76.00 (R1) resistance line, continue to break also the 82.00 (R2) resistance level, paving the way for the 88.60 (R3) hurdle.
USD/CAD Daily Chart
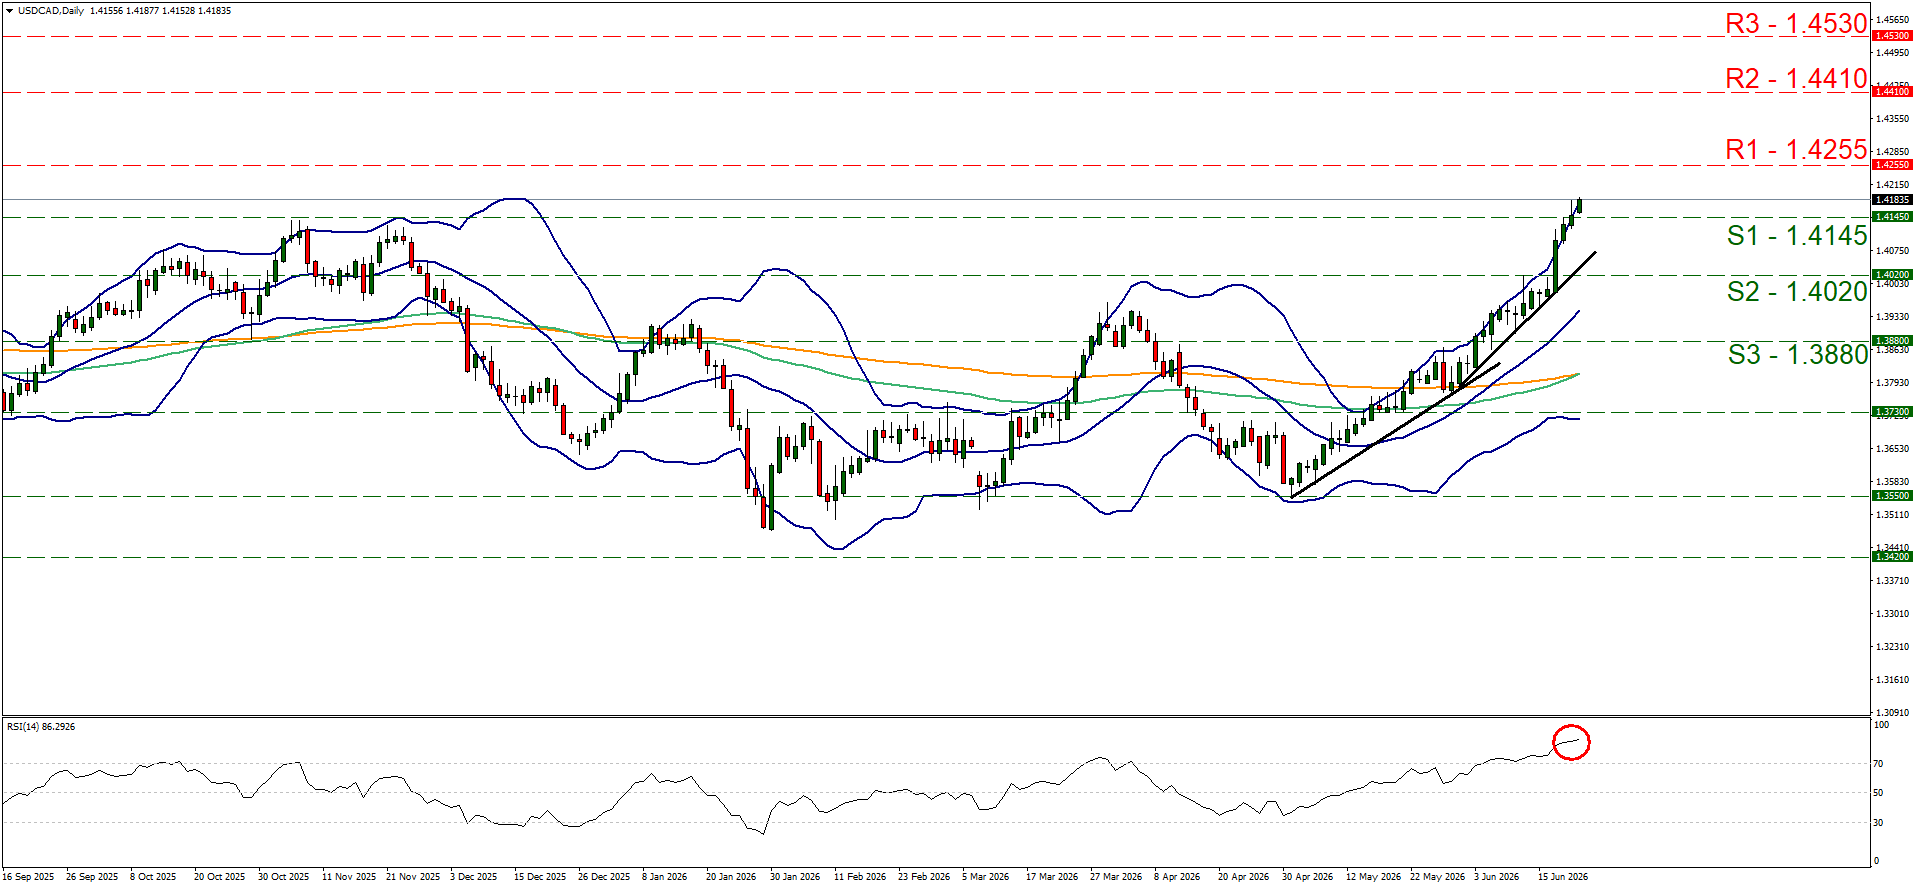
- Support: 1.4145 (S1), 1.4020 (S2), 1.3880 (S3)
- Resistance: 1.4255 (R1), 1.4410 (R2), 1.4530 (R3)
WTI Daily Chart
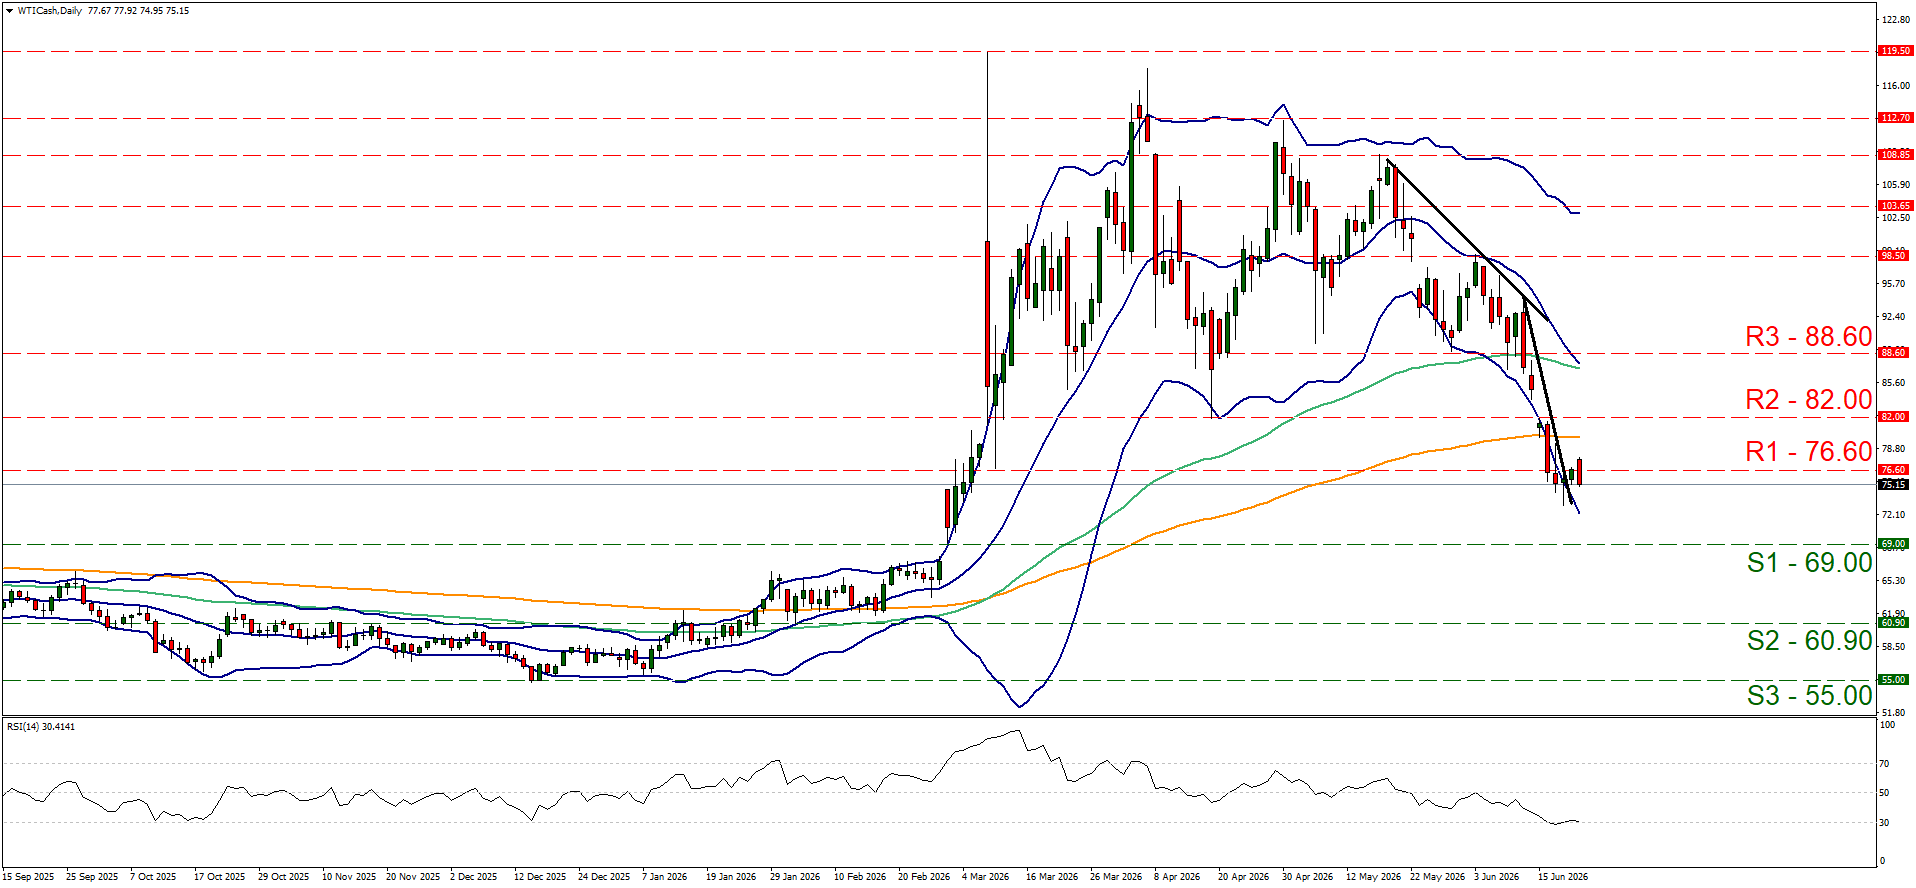
- Support: 69.00 (S1), 60.90 (S2), 55.00 (S3)
- Resistance: 76.60 (R1), 82.00 (R2), 88.60 (R3)
Disclaimer:
This information is not considered as investment advice or an investment recommendation, but instead a marketing communication. IronFX is not responsible for any data or information provided by third parties referenced, or hyperlinked, in this communication.