 KO
KO  EN
EN  FR
FR  ES
ES  PT
PT  ZH
ZH  AR
AR  FA
FA  RU
RU  NL
NL  MS
MS  VI
VI  PH
PH  TH
TH  ID
ID 

JPY’s strengthening dominates the FX market
The continuation of the strengthening of the JPY against the USD as the week, began made headlines. The pair continued to drop almost 1% in today’s Asian session, before paring some losses. The size of the movement enhances the scenario of a continuation of the joint US-Japanese intervention since last week to shore up the Yen, which could drag USD/JPY even lower and changing the landscape in the FX market.
Oil prices drop further
Oil prices dropped at today’s opening as market worries for the situation in the Middle East eased further. US President Trump yesterday stated that he cancelled new airstrikes on Iran, while additional emphasis seems to be placed on new negotiations beginning today. Hopes for a possible re-opening of the Straits of Hormuz could be enhanced, weighing further on oil prices.
US stock markets remain supported
US stock markets were supported as the week began. It seems that the drop in oil prices has improved market sentiment, allowing for a more risk-on market approach favouring US equities. Also, the release of Amazon’s earnings report showed a substantial revenue growth, sending its share price flying and alleviating the market’s worries for a possible overspending in AI.
금일 주요 경제 뉴스
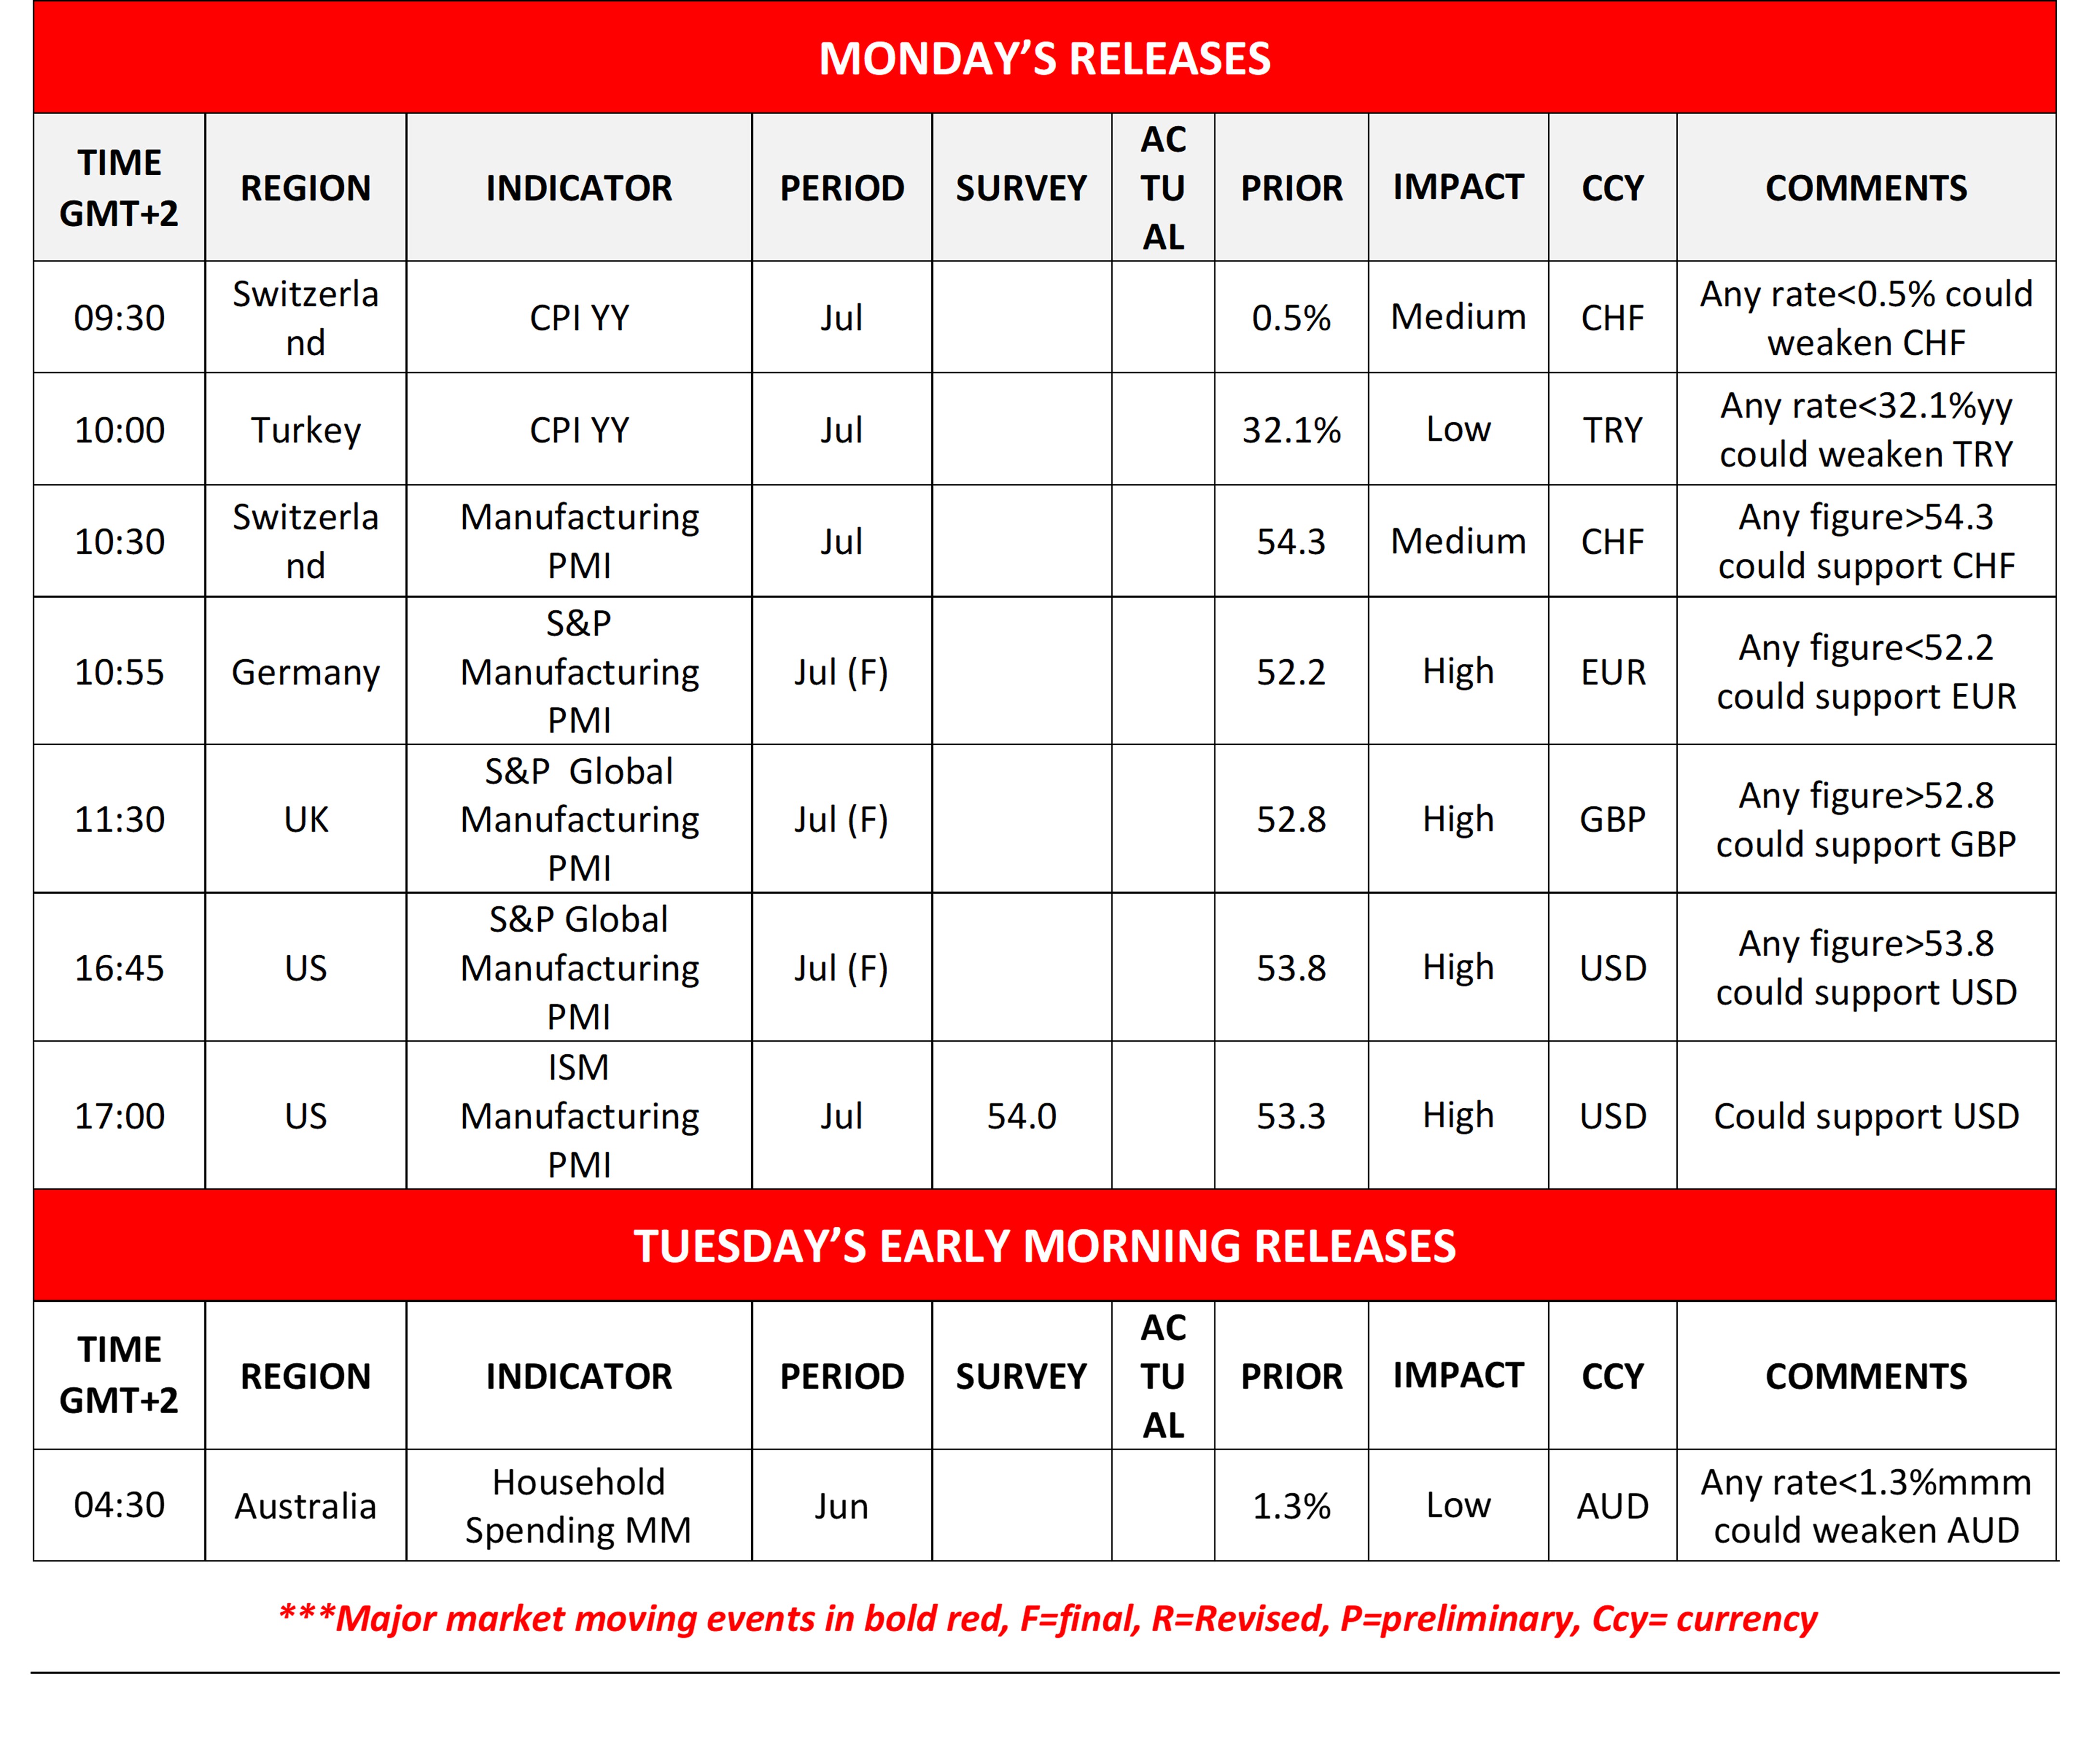
Today we get Switzerland’s CPI rates and manufacturing PMI figure, Turkey’s CPI rates, Germany’s the UK’s and the US manufacturing PMI figures all being for July. In tomorrow’s Asian session, we get Australia’s Household spending for June.
금주 주요 경제뉴스
On Tuesday, we get Canada’s trade data, the US factory orders and the US JOLTS job opening figure all being for June. On Wednesday, we get New Zealand’s employment data for Q2, the Czech Republic’s preliminary CPI rates for July, the US ADP national employment figure for July and the ISM non-manufacturing PMI figure for the same month. On Thursday, we get Australia’s employment data for June, Sweden’s preliminary CPI rates for July, the US weekly initial jobless claims figure and from the Czech Republic, CNB’s interest rate decision. On Friday we get China’s trade data for July, Germany’s industrial output for June, the US employment report for July, Canada’s employment data for July, and Canada’s Iney PMI also for July.
Charts to keep an eye out
USD/JPY tumbled almost 850 pips since Thursday, breaking consecutively a number of support levels, reaching as low as the 155.00 (S1) support line before correcting higher. The bearish outlook is obvious for the pair, yet at the same time we issue a warning for USD/JPY to expand its correction higher. The RSI indicator has dropped below the reading of 30, while the pair’s price action is notably below the lower Bolinger bands, both supporting the possibility of a correction higher. Should the bears remain in charge, USD/JPY may break the 155.00 (S1) support line and aim for the 152.10 (S2) support level. Should the bulls take charge, we may see USD/JPY breaking the 157.50 (R1) resistance base and aim for the 160.50 (R2) resistance level.
Nasdaq edged higher breaking the 28200 (S1) resistance line now turned to support. The index in its upward movement broke also the downward trendline guiding it highlighting the interruption of Nasdaq’s downward movement. The RSI indicator has risen nearing the reading of 50, implying an easing of the bearish market sentiment, yet has failed to break above it which could signal a growing bullish market sentiment for the index. Hence we replace our bearish outlook with a sideways motion bias for now. Should the bulls take over, Nasdaq may aim if not break the 29675 (R1) resistance line. Should the bears have the initiative, Nasdaq may break the 28200 (S1) support line and aim for the 26870 (S2) support level.
USD/JPY Daily Chart
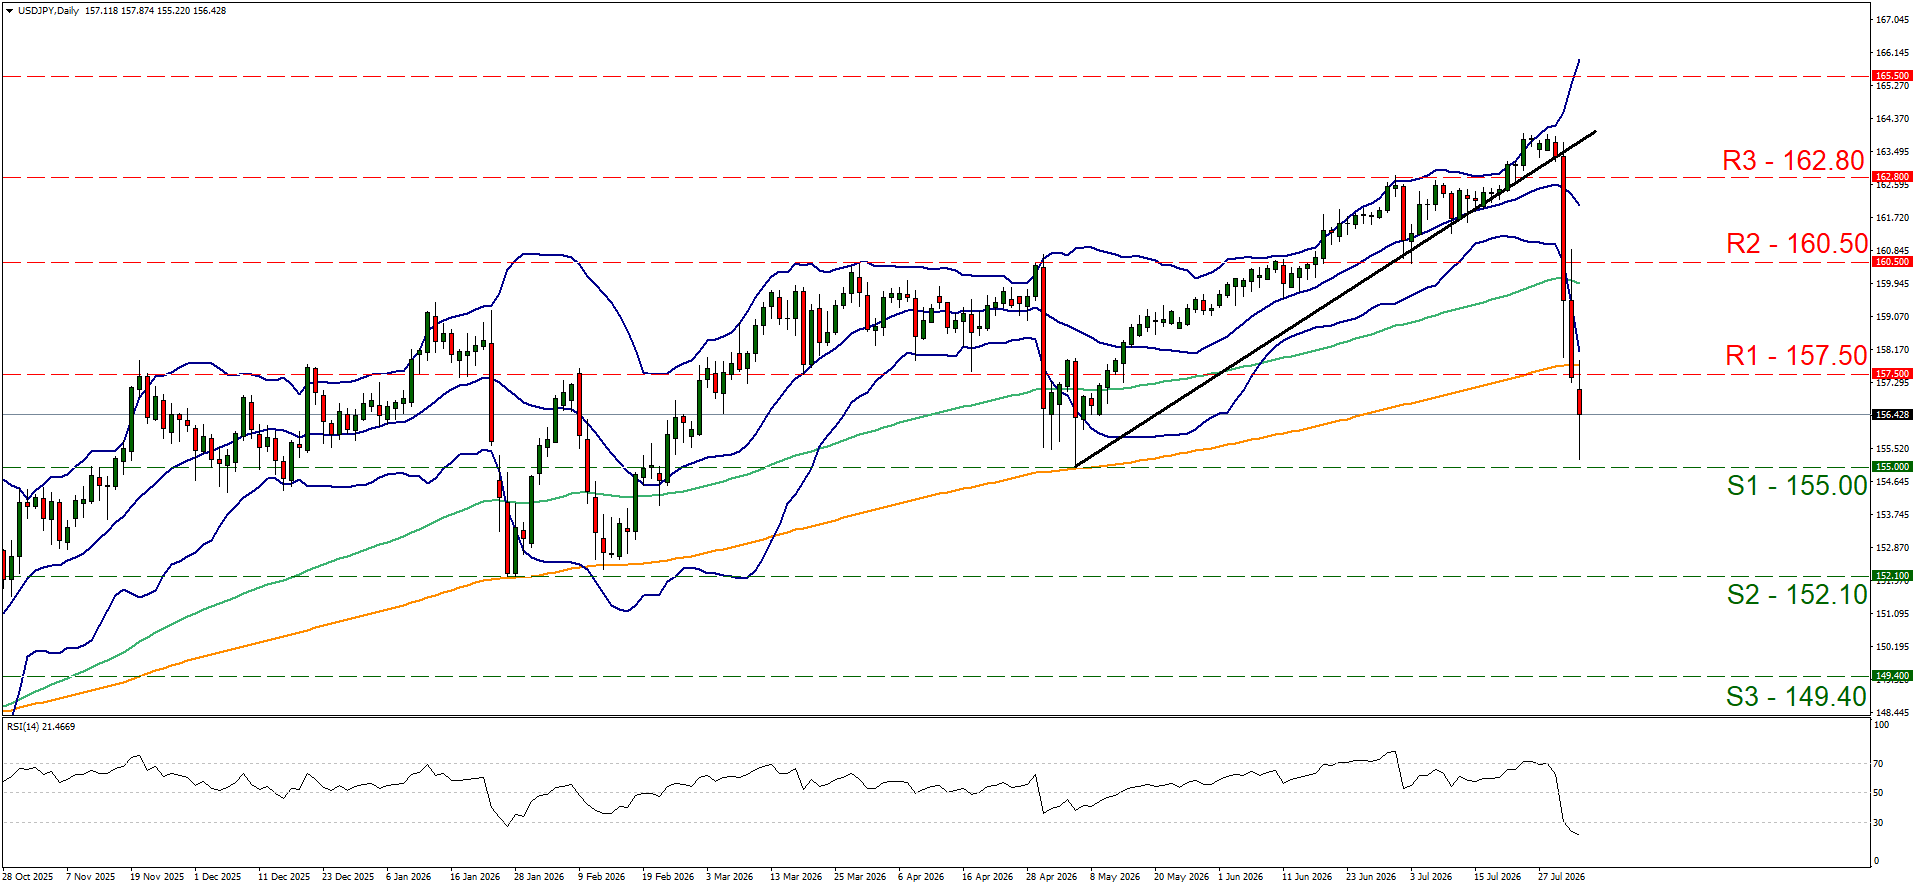
- Support: 155.00 (S1), 152.10 (S2), 149.40 (S3)
- Resistance: 157.50 (R1), 160.50 (R2), 162.80 (R3)
US100 Cash Daily Chart
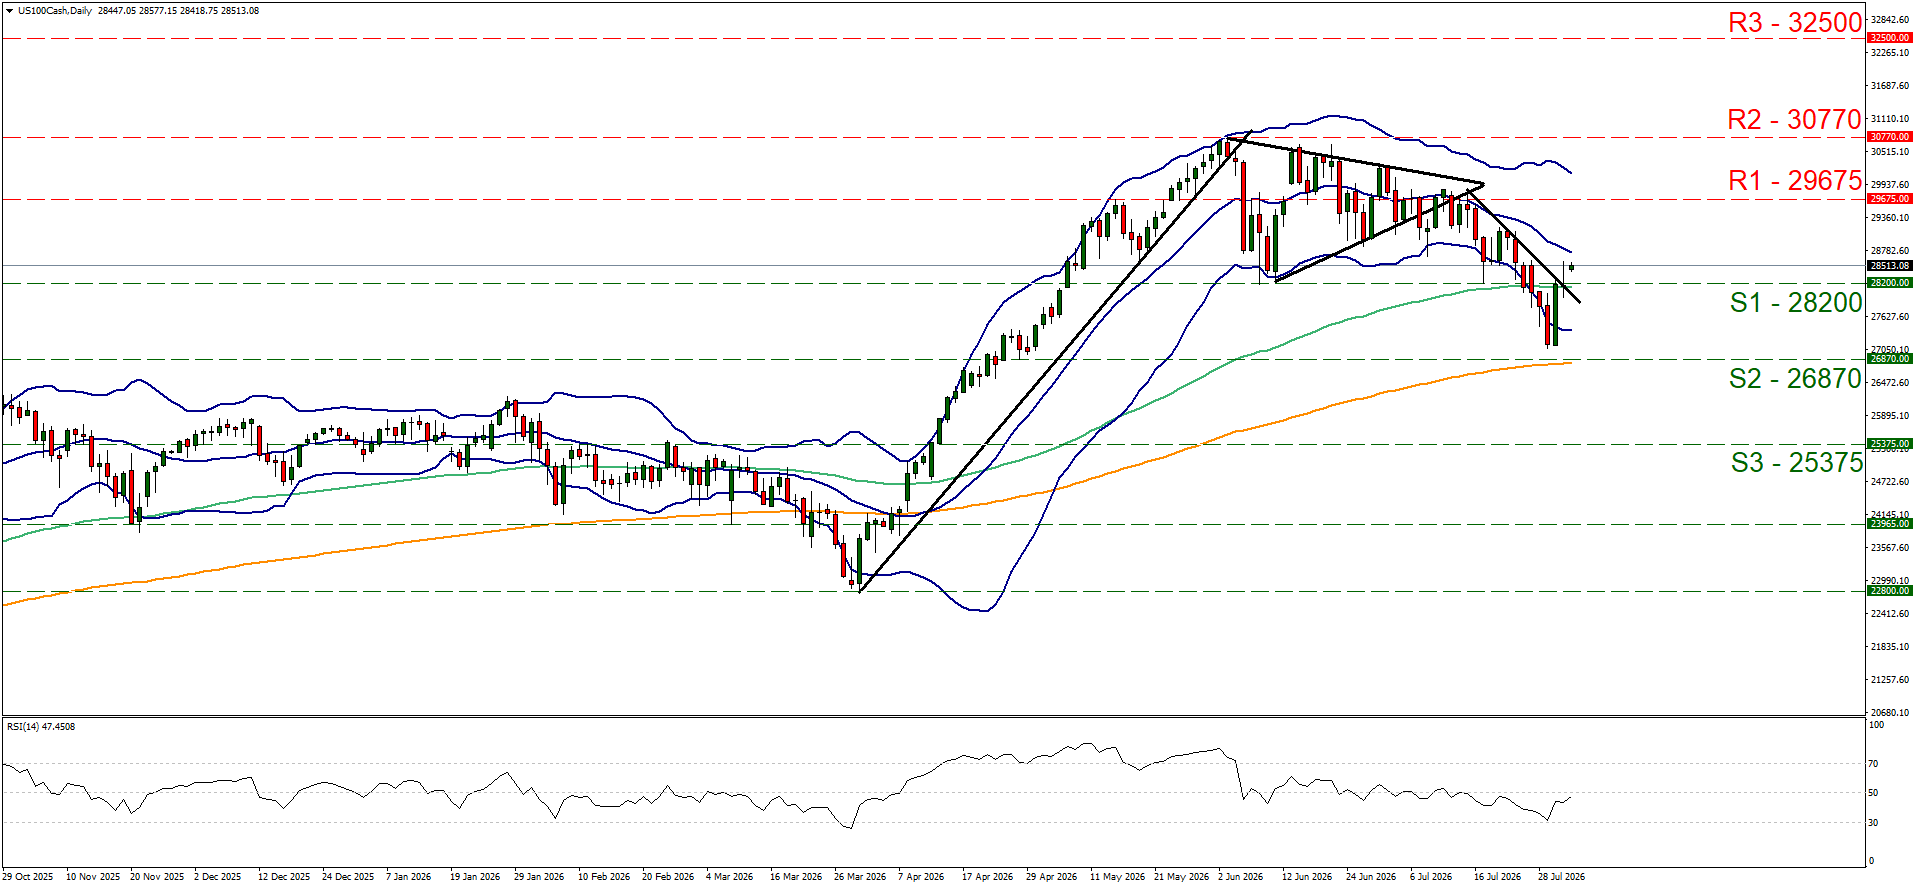
- Support: 28200 (S1), 26870 (S2), 25375 (S3)
- Resistance: 29675 (R1), 30770 (R2), 32500 (R3)
면책 조항:
본 자료는 투자 권유가 아니며 정보 전달의 목적이므로 참조만 하시기 바랍니다. IronFX는 본 자료 내에서 제 3자가 이용하거나 링크를 연결한 데이터 또는 정보에 대해 책임이 없습니다.


