

US stock markets seem to be uncertain as to which direction they should take. In today’s report, we would like to address what fundamentally seems to be driving them, yet also have a look at Tesla regarding its future prospects. We conclude our report with a technical analysis of Nasdaq’s daily chart.
The Fed’s interest rate decision
On Friday, the PCE price index for March, both on a headline as well as on a core level, failed to slow down, implying a persistence of inflationary pressures in the US economy. The release may add pressure on the Fed to maintain a more hawkish stance, which in turn could weigh on US stock markets as the tight financial environment may need to be maintained in order to combat inflation, and thus less of opportunities for growth of US companies may emerge. Moreover, the next big test for US Equities may be the Fed’s interest rate decision later on today, in which the bank is widely expected to remain on hold and currently, Fed Fund Futures (FFF) imply a probability of 99% for such a scenario to materialise. Hence, we expect the market’s attention to turn towards the accompanying statement and Fed Chairman Powell’s press conference for any clues regarding the bank’s future intentions. Should the bank’s forward guidance imply a possible delay of any rate cuts we may see the market’s expectations being contradicted and the USD getting some support. At the same time, a continuation of the tight financial environment in the USA, could weigh on the US stock markets. On the flip side, should the bank’s accompanying statement and Fed Chair Powell’s press conference, imply an easing of tight financial conditions in the US markets, it could provide support for US Equities.
Tesla’s Chinese lifeline
We are forced to discuss Tesla once again after last week’s report, yet the news surrounding Tesla appear to be positive for this week. In particular, we are referring to the surprise visit taken by Elon Musk to China which appears to have born some fruit. According to the Financial Times, Tesla’s (#TSLA) CEO struck a deal with China’s Baidu (#BIDU) over the use of Baidu’s mapping and navigational systems, a legal requirement for EV makers looking to sell “smart” cars in China. The agreement could potentially increase Tesla’s EV sales and subscription revenues in China, which is the world’s largest automobile market, and thus may lead to an increase in revenue for Tesla in the future. In conclusion, the aforementioned possibility appears to have increased investor’s confidence in Tesla and thus following the announcement, the company’s stock price moved higher. Yet, in the same report the FT quoted an expert in Chinese technology regulation, who claims that the agreement was not a “certification, it’s not an approval, it’s just an assessment”. Hence, should Tesla fail to materialize investors’ expectations which we mentioned above, it could weigh on the company’s stock price.
US Financial releases
The second market-moving event is expected to be the release of the US employment report for April on Friday. Overall forecasts are for the NFP figure to drop and the unemployment rate to rise, implying an easing of the US employment market that may in turn ease the hawkishness of the Fed which may weaken the dollar, whilst potentially providing support for US Equities. Yet there is a wide degree of uncertainty regarding the actual release, as the rates and figures of the report took the markets by surprise a number of times in the past months and should the US employment market prove to be more resilient than forecasted, we may see it weighing on US stock markets, as the implication of tighter financial conditions may discourage investors.
Teknikal na Pagsusuri
#US100 Cash Daily Chart
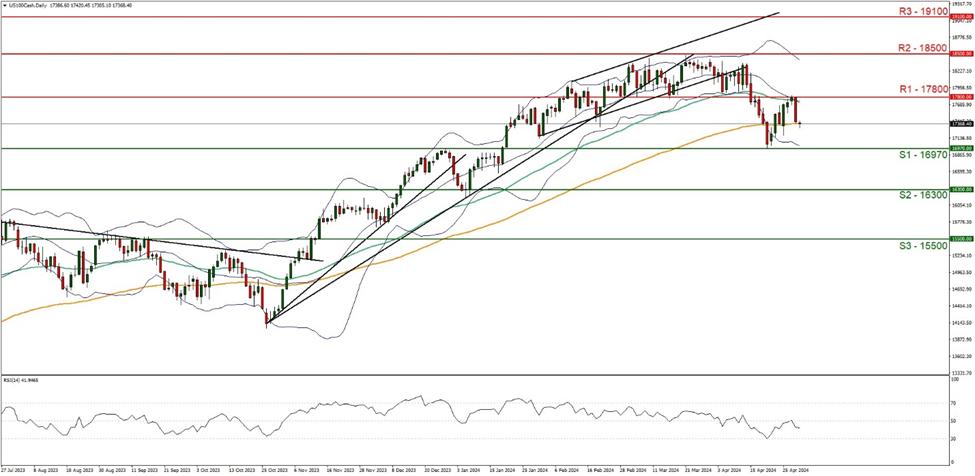
Support: 16970 (S1), 16300 (S2), 15500 (S3)
Resistance: 17800 (R1), 18500 (R2), 19100 (R3)
Nasdaq failed to clearly break the 17800 (R1) resistance line. We tend to maintain a sideways bias for the index and supporting our case is the failing of the index to break above our R1 resistance level, in addition to the smoothening out of the 50MA and 100MA lines. Yet there are some indications that the bears may be taking over the direction of the index, with the Bollinger bands now seemingly titled downwards in addition the the RSI indicator below our chart currently registering a figure near 40, seem to imply bearish market tendencies. Nonetheless, for our sideways bias to continue we would require the index to remain confined between the 16970 (S1) support level and the 17800 (R1) resistance line. On the flip side for a bearish outlook we would require a clear break below the 16970 (S1) support level with the next possible target for the bears being the 16300 (S2) support base. Lastly, for a bullish outlook we would require a clear break above the 17800 (R1) resistance line with the next possible target for the bulls being the 18500 (R2) resistance level.
If you have any general queries or comments relating to this article please send an email directly to our Research team at research_team@ironfx.com
Disclaimer:
This information is not considered as investment advice or an investment recommendation, but instead a marketing communication. IronFX is not responsible for any data or information provided by third parties referenced, or hyperlinked, in this communication.


