 PT
 EN
 FR
 ES
 KO
 ZH
 AR
 FA
 RU
 NL
 MS
 VI
 PH
 TH
 ID


Since our last report Gold’s price, appears to be moving in a sideways trajectory. In today’s report we are to discuss mainly fundamental issues, and we intend to end the report with a technical analysis of Gold’s daily chart.
US PMI data due out this week
The US S&P preliminary PMI data for October is set to be released this week. The PMI data may provide insight into the state of the US economy, in terms of manufacturing, service and the composite for an overall image. Therefore, should the readings showcase a resilient US economy, it may provide support for the greenback whilst weighing on the precious metal’s price considering the inverse relationship of the two assets. Moreover, with the US mid-terms approaching, financial releases stemming from the US may garner even greater interest as they could be used from a political level, which could translate into a greater impact on the related assets, i.e gold and the dollar.
FOMC meeting next week
The FOMC’s next meeting is set to take place next week. The majority of market participants are currently anticipating the bank to remain on hold at 3.75-4% with FFF currently implying an 85.1% probability for such a scenario. Considering the importance of the FOMC’s decision on the markets, we may see the implications of the Fed’s next decision dominating the airwaves this week, as market participants prepare for the decision. Moreover, considering the market’s expectations at this point, we could see attention shifting to the Fed’s narrative post-decision and how the Fed may proceed going forward. In turn any hawkish commentary could provide support for the dollar whilst weighing on the precious metal’s price and vice versa.
Bonds on the menu – WGC
According to a report released by the WGC, “The 10-year Treasury rally (yield drop) during the current Nasdaq sell-off stands out, particularly as inflation has recently surprised to the upside. Reminiscent of February 2025, when inflation was also picking up, but unlike July 2024 when it was softening, it suggests investors may be looking to bonds for safety again as equity risks intensify (C.O.T.W). For gold it sends a mixed message: renewed bond demand might compete for safe-haven flows, but falling yields reduce gold’s opportunity cost and could provide support if the equity rout worsens”. Essentially, implying that should the equity route continues to worsen, we may see a safe haven outflows from gold and into bonds considering their interest-bearing nature. Moreover, with Anthropic’s IPO in sight the AI spending concerns that have emerged could be amplified which could weigh on gold’s price.
Análise técnica
XAU/USD Daily Chart
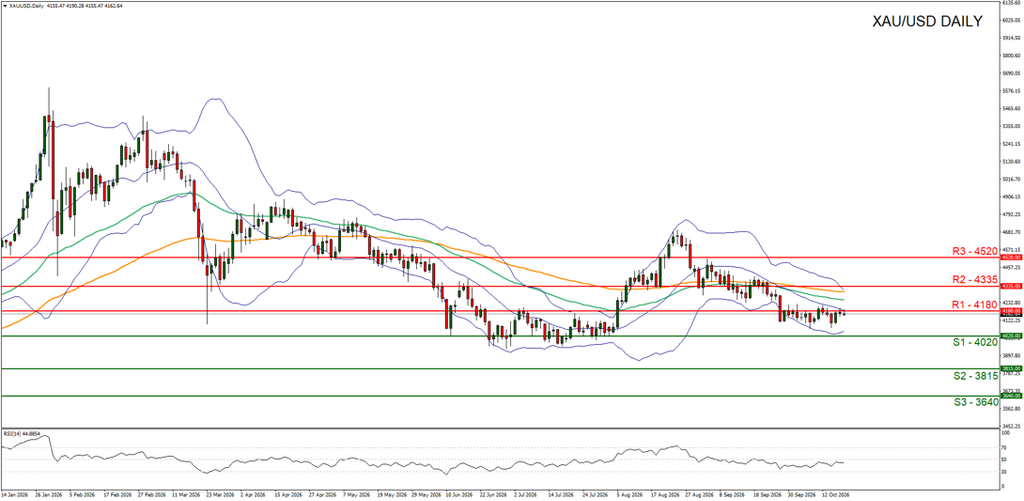
Resistance: 4180 (R1), 4335 (R2), 4520 (R3)
Gold’s price appears to be moving in a sideways fashion despite currently testing our 4180 (R1) resistance level. We opt for a sideways bias for gold’s price and supporting our case is gold’s failure to clear our aforementioned R1 level. For our sideways bias to be maintained, we would require the precious metal’s price to remain between our 4020 (S1) support level and our 4180 (R1) resistance line. On the other hand, for a bearish outlook we would require a break below our 4020 (S1) support line with the next possible target for the bears being our 3815 (S2) support level. Lastly, for a bullish outlook we would require a clear break above our 4180 (R1) resistance line, with the next possible target for the bulls being our 4335 (R2) resistance level.
DISCLAIMER: This information is not considered as investment advice or an investment recommendation, but is instead a marketing communication.


