 PT
 EN
 FR
 ES
 KO
 ZH
 AR
 FA
 RU
 NL
 MS
 VI
 PH
 TH
 ID


Since our last report Gold’s price, appears to be moving in a downwards trajectory. In today’s report we are to discuss mainly fundamental issues, and we intend to end the report with a technical analysis of Gold’s daily chart.
US Midterms tomorrow
The US Midterms are set to take place tomorrow. The midterm outcome appears uncertain, yet we should note that the Democrats appear to have a more favourable position for flipping the House of Representatives. Nonetheless, gold’s reaction will depend on how control of Congress splits. If Democrats win one chamber, a divided Congress could weigh on US equities, with a Bloomberg survey pointing to legislative gridlock and tighter AI regulation as concerns, and foreign and fiscal policy flagged as key post-election risks.
If Democrats win both chambers, policy shifts could be larger, but the market impact is less clear. For gold, the impact is mixed either way. Volatility could boost safe-haven demand, but a rate and liquidity-driven sell-off may weigh on prices. Fiscal gridlock could also be a concern for market participants, as a near-term headwind for gold that strengthens its longer-term case
US Employment data Friday
US employment data for October is due on Friday, with Nonfarm Payrolls figure expected to improve to 63k from 29k in the previous reading. The unemployment rate is forecast to hold steady at 4.2%. However, the report is notorious for deviating from forecasts, so the headline figure could surprise in either direction. For gold, the labour market data matters because it shapes expectations for Federal Reserve policy.
A stronger-than-expected print could lift Treasury yields and the US dollar while reducing bets on rate cuts, which would weigh on non-yielding gold. A weaker print, or a rise in the unemployment rate, could strengthen rate-cut expectations and pressure the dollar, which would support gold. An in-line result could leave the metal range-bound, with traders then looking to other data and Fed commentary for direction
Análise técnica
XAU/USD Daily Chart
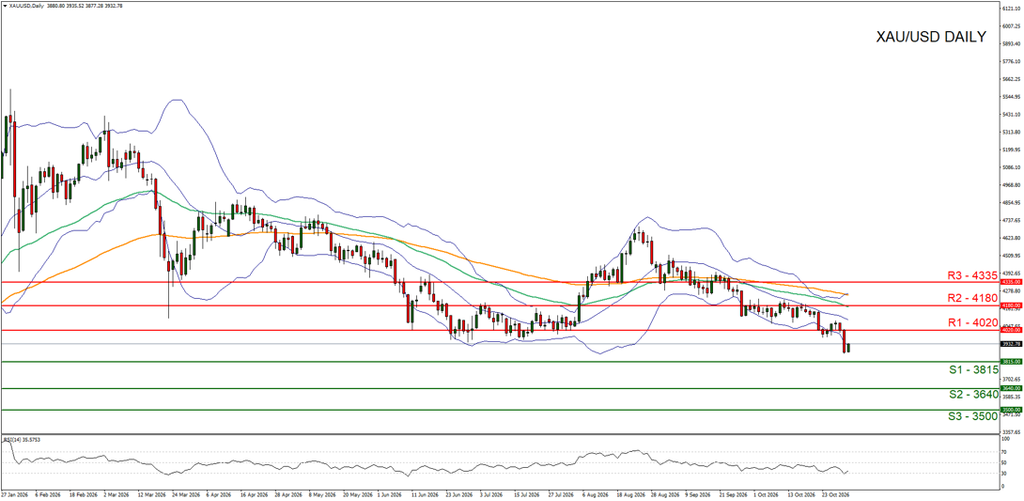
Resistance: 4020 (R1), 4180 (R2), 4335 (R3)
Gold’s price appears to a predominantly downwards fashion with gold having broken below our support now turned to resistance at the 4020 (R1) level. We opt for a bearish outlook for gold’s price and supporting our case is the RSI indicator below our chart which tends to imply a bearish market sentiment. For our bearish outlook to be maintained we would require a break below our 3815 (S1) support level, with the next possible target for the bears being our 3640 (S2) support line.
On the other hand, for a sideways bias we would require gold’s price to remain confined between our 3815 (S1) support level and our 4020 (R1) resistance line. Lastly, for a bullish outlook we would require a break above our 4020 (R1) resistance line with the next possible target for the bulls being our 4180 (R2) resistance level.
AVISO LEGAL: This information is not considered as investment advice or an investment recommendation but is instead a marketing communication.


