
US employment report for April to shake the markets as investors prepare for potential volatility across major asset classes.
The USD has already gained support from safe-haven flows amid renewed US-Iran tensions, while attention now shifts to today’s Non-Farm Payrolls release, where a weaker print is expected but a tighter labour market could still provide USD support.
At the same time, oil prices remain sensitive to geopolitical developments, US equities are attempting to stabilise after recent declines, and Bitcoin continues to correct lower ahead of key political and macroeconomic catalysts.
April’s US employment report to shake the markets
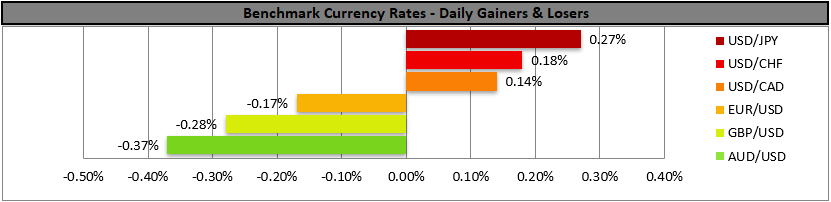
The USD gained some ground in the FX market yesterday as safe haven inflows were created by renewed hostilities between the US and Iran.
Despite the USD’s safe haven status, we highlight the release of the US employment report for April today.
The NFP figure is expected to drop substantially, while the unemployment rate to remain unchanged, should the actual rates and figures show a tighter than expected US employment market, we may see the USD getting some support.
Oil prices wobble after renewed hostilities
The renewed hostilities in the US-Iran conflict caused US stock markets to drop, as uncertainty emerged.
We expect the situation to calm down and market confidence to be renewed, thus supporting US equities.
Yet we also highlight the release of April’s US employment report later today and a possibly tighter-than-expected US employment market may weigh on US stock markets.
Bitcoin correcting lower
Bitcoin seems to correct lower, ahead of US President Trump’s speech later today. The renewal of tensions provided a dash of uncertainty in the markets, also possibly weighing on the crypto market.
We also note that Strategy’s Saylor repeated that they will not be selling Bitcoin, yet the market seems to doubt that. Overall we see the drop of BTC as mostly technical currently.
今日其他经济亮点
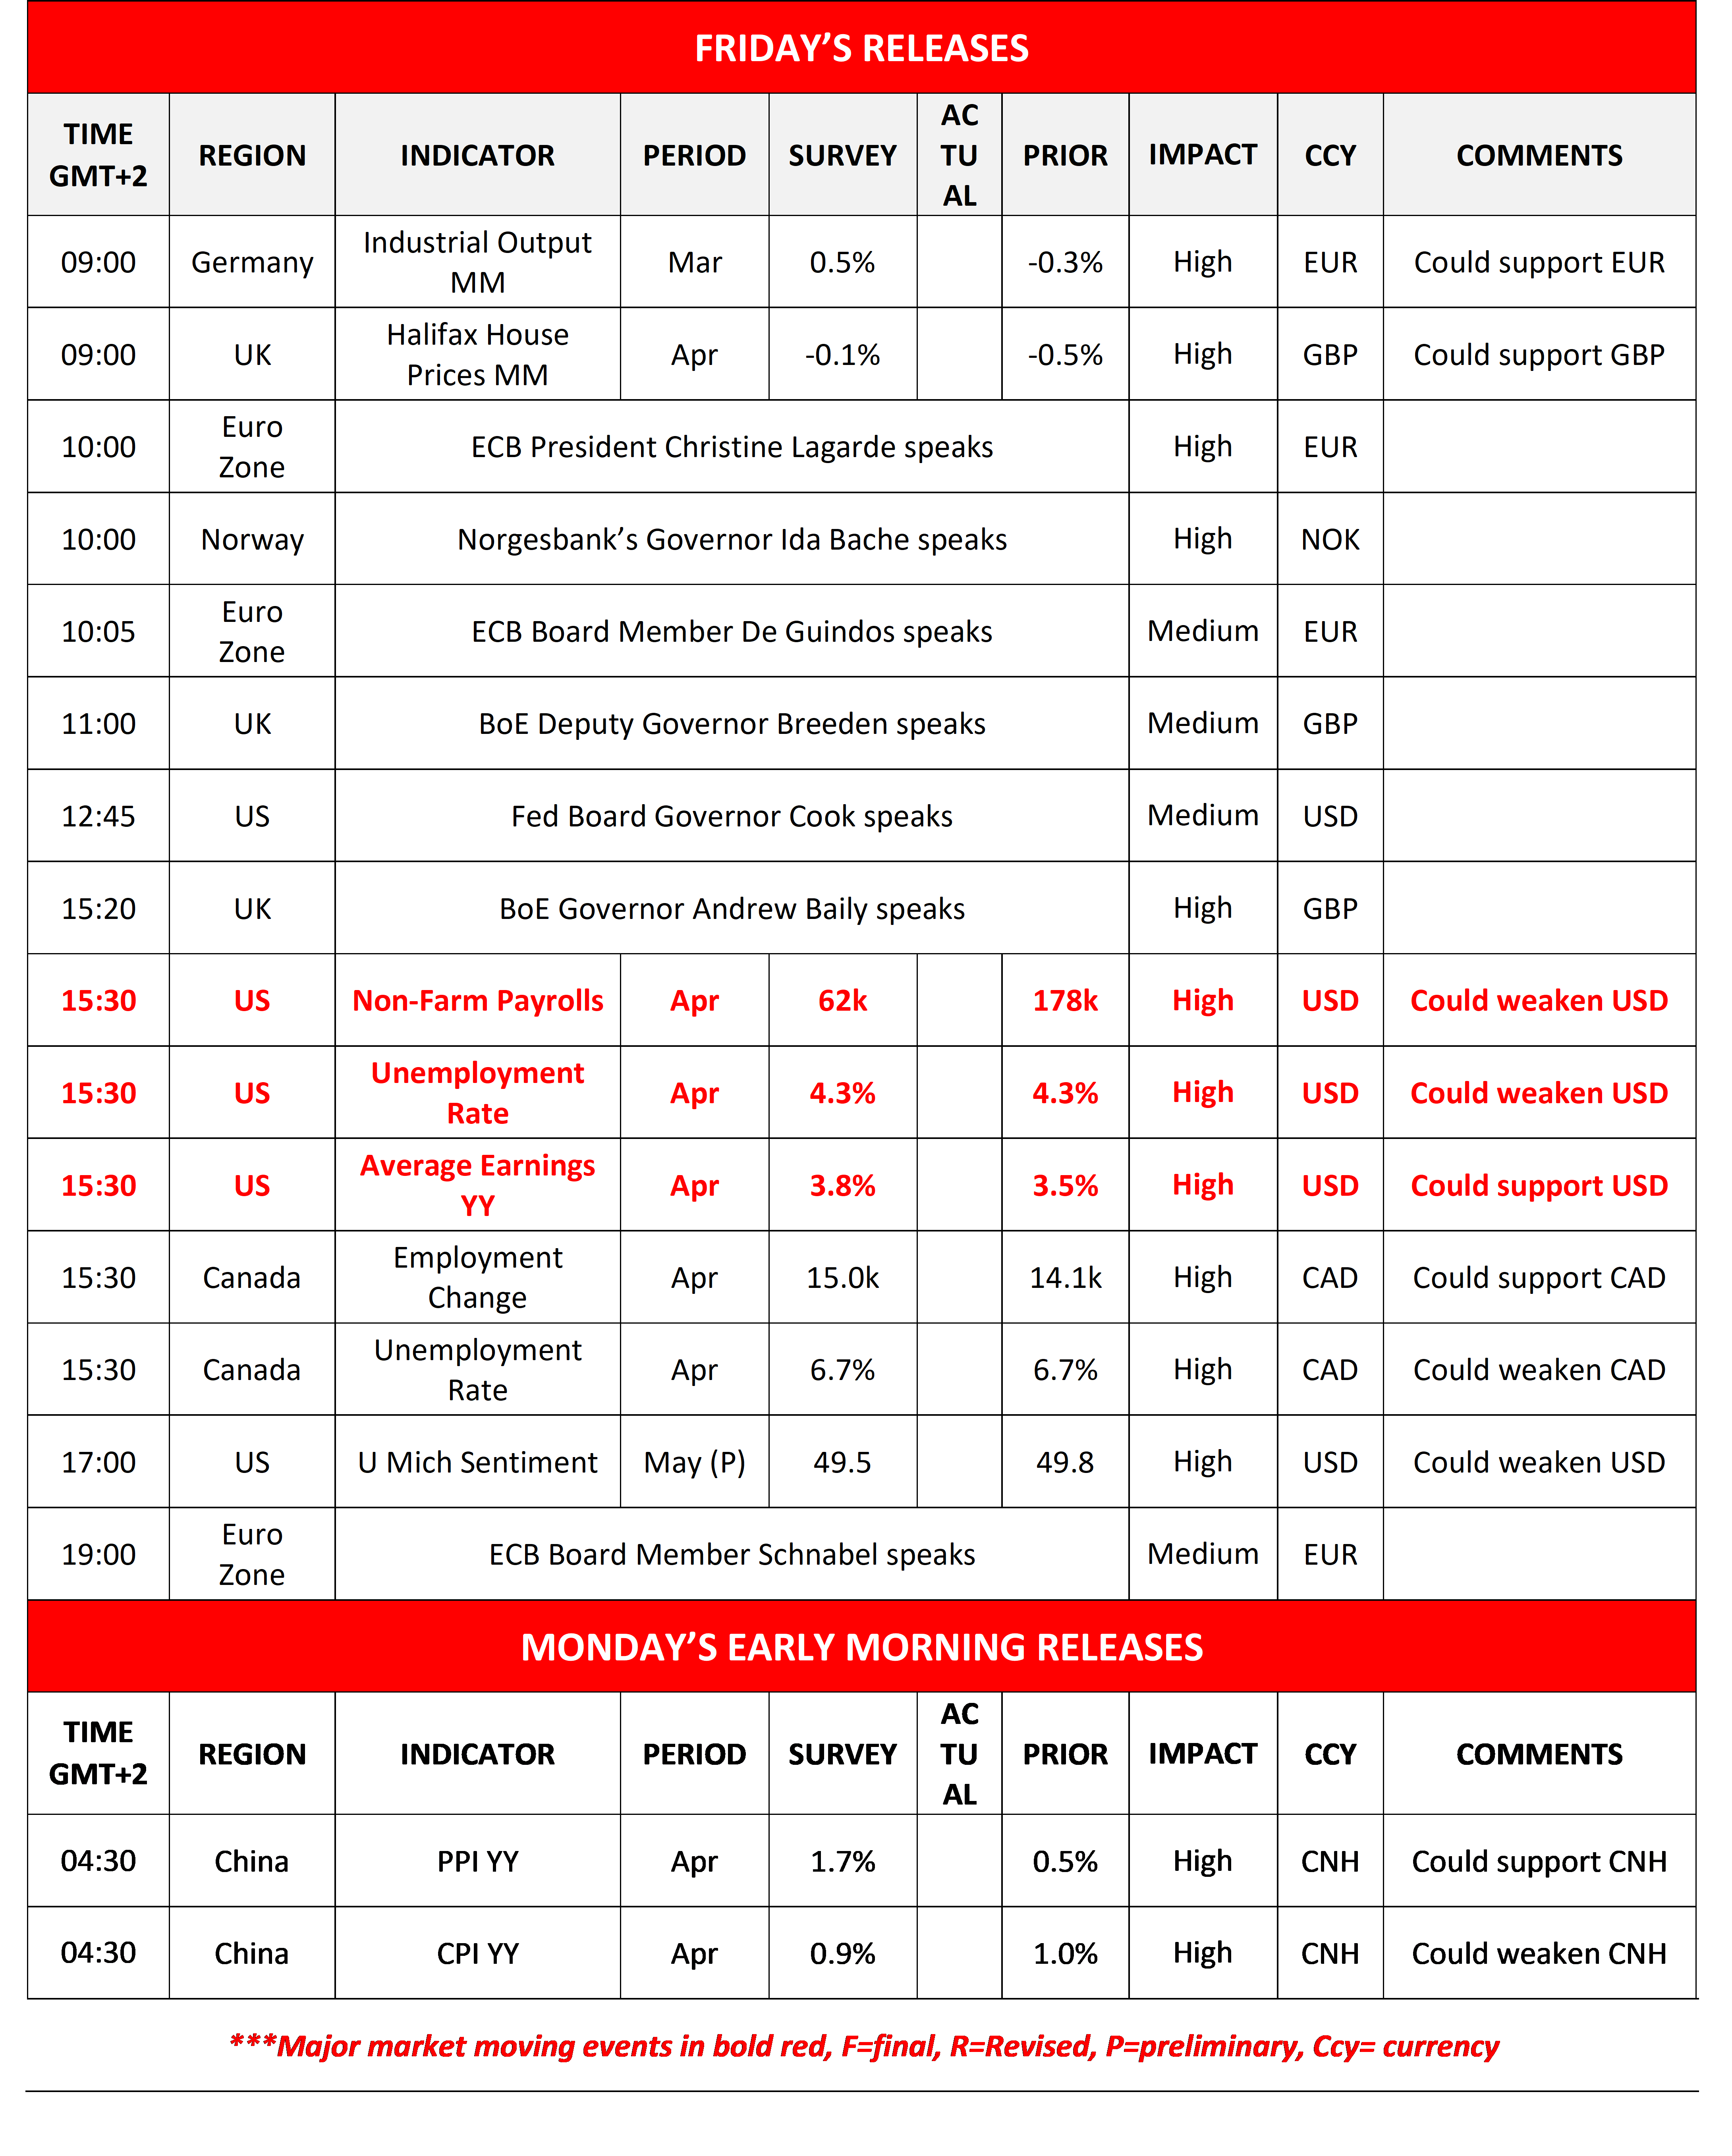
Today we get Germany’s industrial output for March, UK’s Halifax House Prices for April, Canada’s employment data April and the preliminary US UoM consumer sentiment for May.
On a monetary level, we note that ECB’s Lagarde, De Guindos, Schnabel, BoE’s Breeden, Bailey and the Fed’s Cook are scheduled to speak. In Monday’s Asian session, we note the release of China’s inflation metrics for April.
Charts to keep an eye out
USD/CAD
USD/CAD rose yesterday, yet remained well within the boundaries set by the 1.3720 (R1) resistance line and the 1.3550 (S1) support level. As USD/CAD’s price action broke the downward trendline guiding it, we switch our bearish outlook in favour of a sideways motion for now.
We note that the RSI indicator has risen, nearing the reading of 50, implying an easing of the market’s bearish sentiment for the pair. Yet the simultaneous release of the US and Canadian employment data for April could alter the direction of the pair depending on the rates and figures to be released.
Should the bears regain control we may see USD/CAD breaking the 1.3550 (S1) support line and start aiming for the 1.3420 (S2) support level. Should the bulls take over we may see USD/CAD breaking the 1.3720 (R1) resistance line and start aiming for the 1.3880 (R2) level.
Nasdaq
Nasdaq hesitated yesterday, yet continued to rise in today’s Asian session testing the 28750 (R1) resistance line. We maintain yesterday’s bullish outlook for the index and intend to keep it as long as the upward trendline guiding it, remains intact.
Should the bulls remain in charge, we may see the index’s price action breaking the 28750 (R1) resistance line and start aiming the 30000 (R2) resistance level.
Should the bears take over, we may the index breaking initially the prementioned upward trendline, continue to break the 27500 (S1) support level and set its sights on the 26250 (S2) support level.
USD/CAD Daily Chart
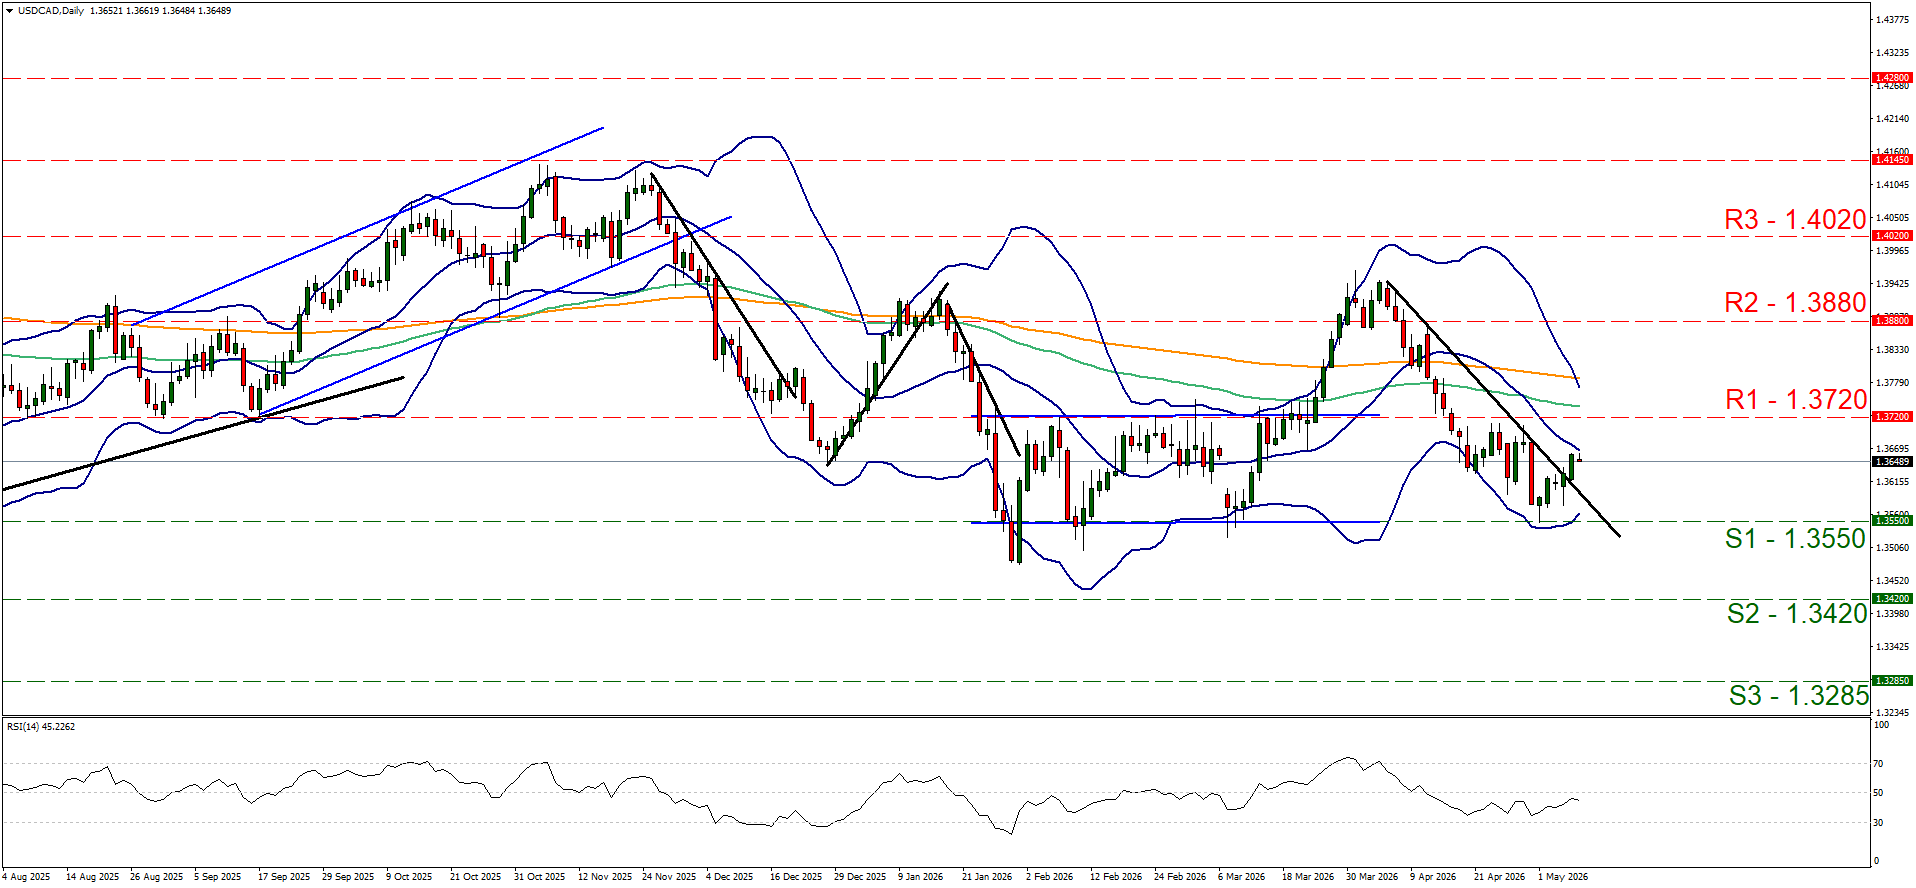
- Support: 1.3550 (S1), 1.3420 (S2), 1.3285 (S3)
- Resistance: 1.3720 (R1), 1.3880 (R2), 1.4020 (R3)
US 100 Cash Daily Chart
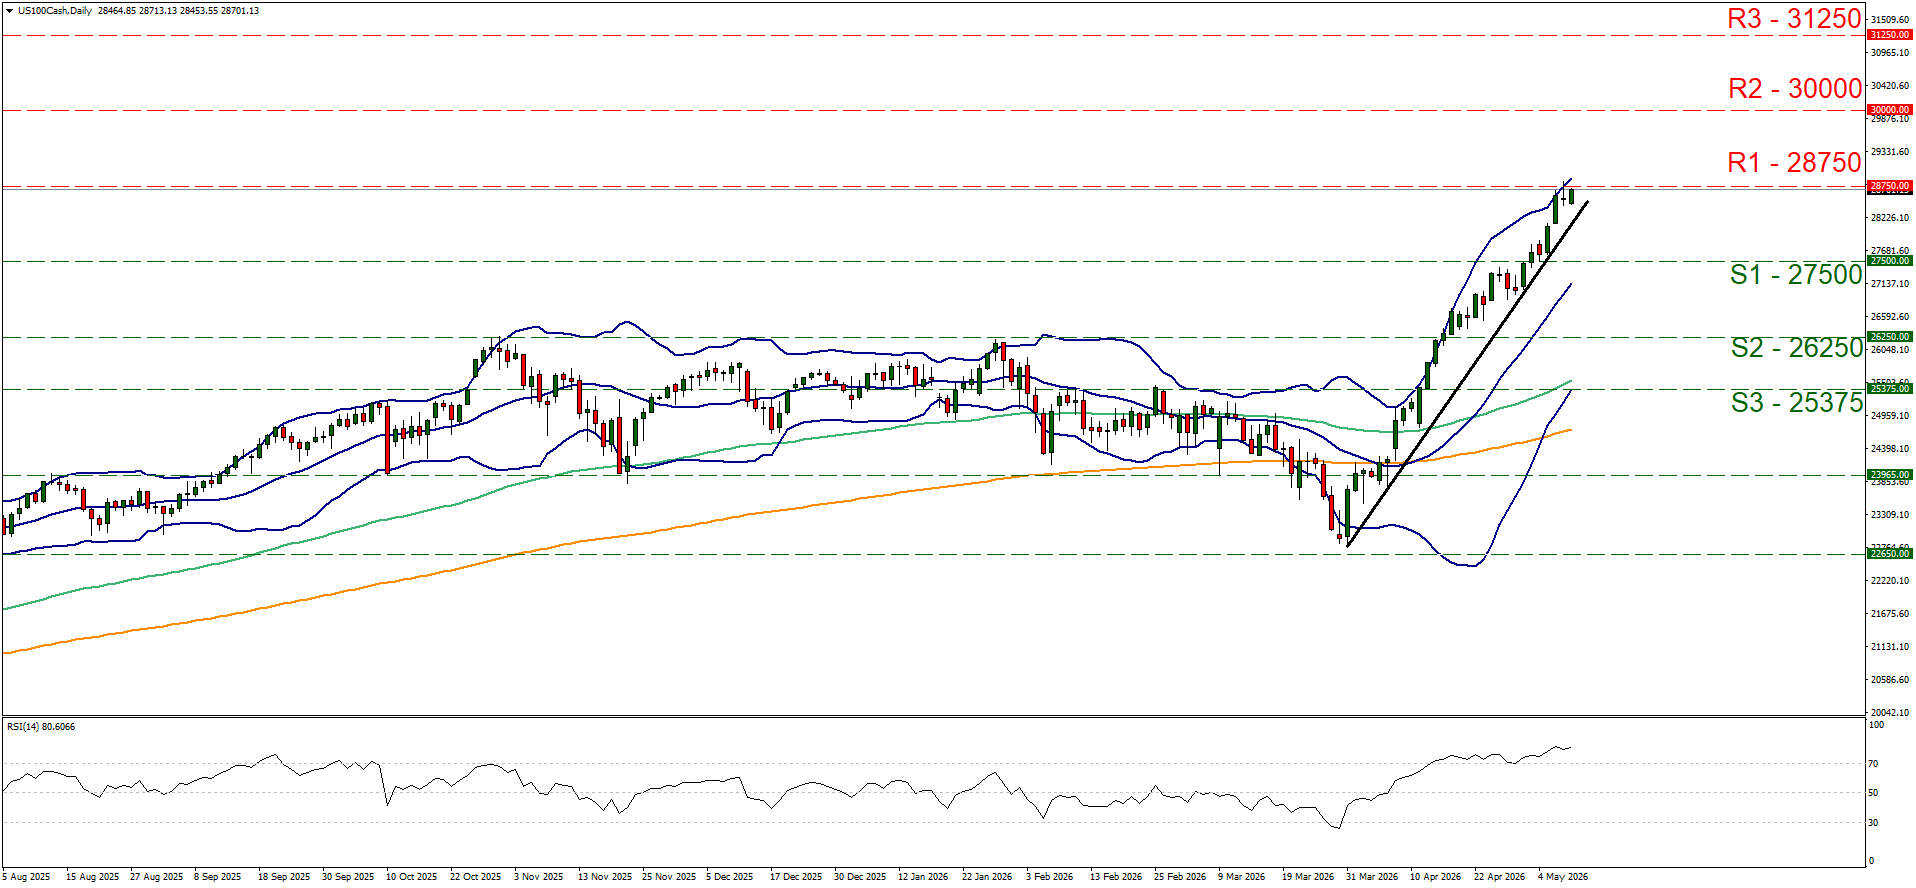
- Support: 27500 (S1), 26250 (S2), 25375 (S3)
- Resistance: 28750 (R1), 30000 (R2), 31250 (R3)
免责声明:
本信息不被视为投资建议或投资推荐, 而是一种营销传播. IronFX 对本信息中引用或超链接的第三方提供的任何数据或信息概不负责.