
Cautious market sentiment eases as the week begins, with investors digesting stronger-than-expected US employment data that reinforced the US dollar’s dominance across the FX market. While expectations for tighter Federal Reserve policy continue to support the greenback, risk appetite remains mixed as traders assess weakness in US equities, stability in oil prices despite geopolitical tensions, and ongoing pressure in the cryptocurrency market. Market participants now turn their attention to a busy economic calendar, including key inflation data, central bank decisions, and growth indicators that could shape sentiment and drive volatility in the days ahead.
The USD remains dominant
The USD was dominant in the FX market on Friday as a stronger US employment report for May, rejuvenated the market’s expectations for the Fed to tighten its monetary policy. With the market now expecting the bank to start raising rates in October, the Fed’s intentions seem to be key, regarding USD’s direction, yet its safe-haven status may also play a role in the coming days.
US stock markets plunge
US stock market indexes dropped on Friday as the possibility of a tighter monetary policy by the Fed tended to counterbalance the markets’ optimism about the potentials of AI technology. We also detect some worries for the tech sector being overvalued, thus the correction lower for Nasdaq was wider than Dow Jones and S&P 500. Should the market worries remain we may see US equities losing further ground.
Oil prices remain stable
Oil prices remained relatively stable despite the flare-up of tensions in the Middle East. OPEC has announced another output hike yet that seems to be overshadowed for now. Should tensions in the Middle East continue to escalate, threatening to keep the Straits of Hormuz closed for longer, oil prices may get some support.
BTC tumbles
The crypto market continued to tumble as mentioned in our last report, with BTC dipping below $60k. Market worries for the weakness of the demand side in the crypto market, regulatory uncertainty and the market expectations for the Fed to hike rates also, are still present and continue to weigh on a fundamental level.
Other highlights for today
Today we get Germany’s industrial orders for April and Euro Zone’s Sentix Index for June. In tomorrow’s Asian session, we get Australia’s consumer confidence for June and Business conditions and confidence for May as well as China’s trade data for May.
As for the rest of the week
On Tuesday we get Canada’s trade data for April, Japan’s May PPI rates, China’s May inflation metrics, Sweden’s April GDP rates, Norway’s May CPI rates, the US CPI rates also for May and from Canada, BoC’s interest rate decision. On Thursday we get Sweden’s CPI rates for May, from Turkey CBT’s and the Euro Zone’s ECB interest rate decisions, the US initial jobless claims and the US PPI rates for May. On Friday we note the release of UK’s GDP rate for April and the preliminary US June UoM indicators.
Charts to keep an eye out
Nasdaq
Nasdaq’s price action tumbled on Friday breaking the 29680 (R1) support line now turned to resistance. As the index’s price action has broken the upward trendline clearly thus abandon our bullish outlook and expect its price action to stabilise somewhat, yet the bearish tendencies of the index should not be underestimated. Should the bears take over, we may see Nasdaq breaking the 28570 (S1) support line and start aiming for the 27500 (S2) support level. Should the bulls take over we may see the index breaking the 29680 (R1) resistance level and start aiming for the 31000 (R2) resistance level.
BTC/USD
BTC/USD hit a floor on Sunday at the 59800 (S1) support line. The bearish market sentiment seems to be easing, yet the RSI indicator remains at very low levels. On the flip side, the crypto’s downward movement has been interrupted suggesting that also a stabilisation of the crypto is also possible. Should the bears maintain control we may see BTC/USD breaking the 59800 (S1) support line and start aiming for the 53500 (S2) support level. Should the bulls take over, BTC/USD may break the 64900 (R1) resistance level and start aiming for the 74200 (R2) resistance hurdle.
US100Cash Daily Chart
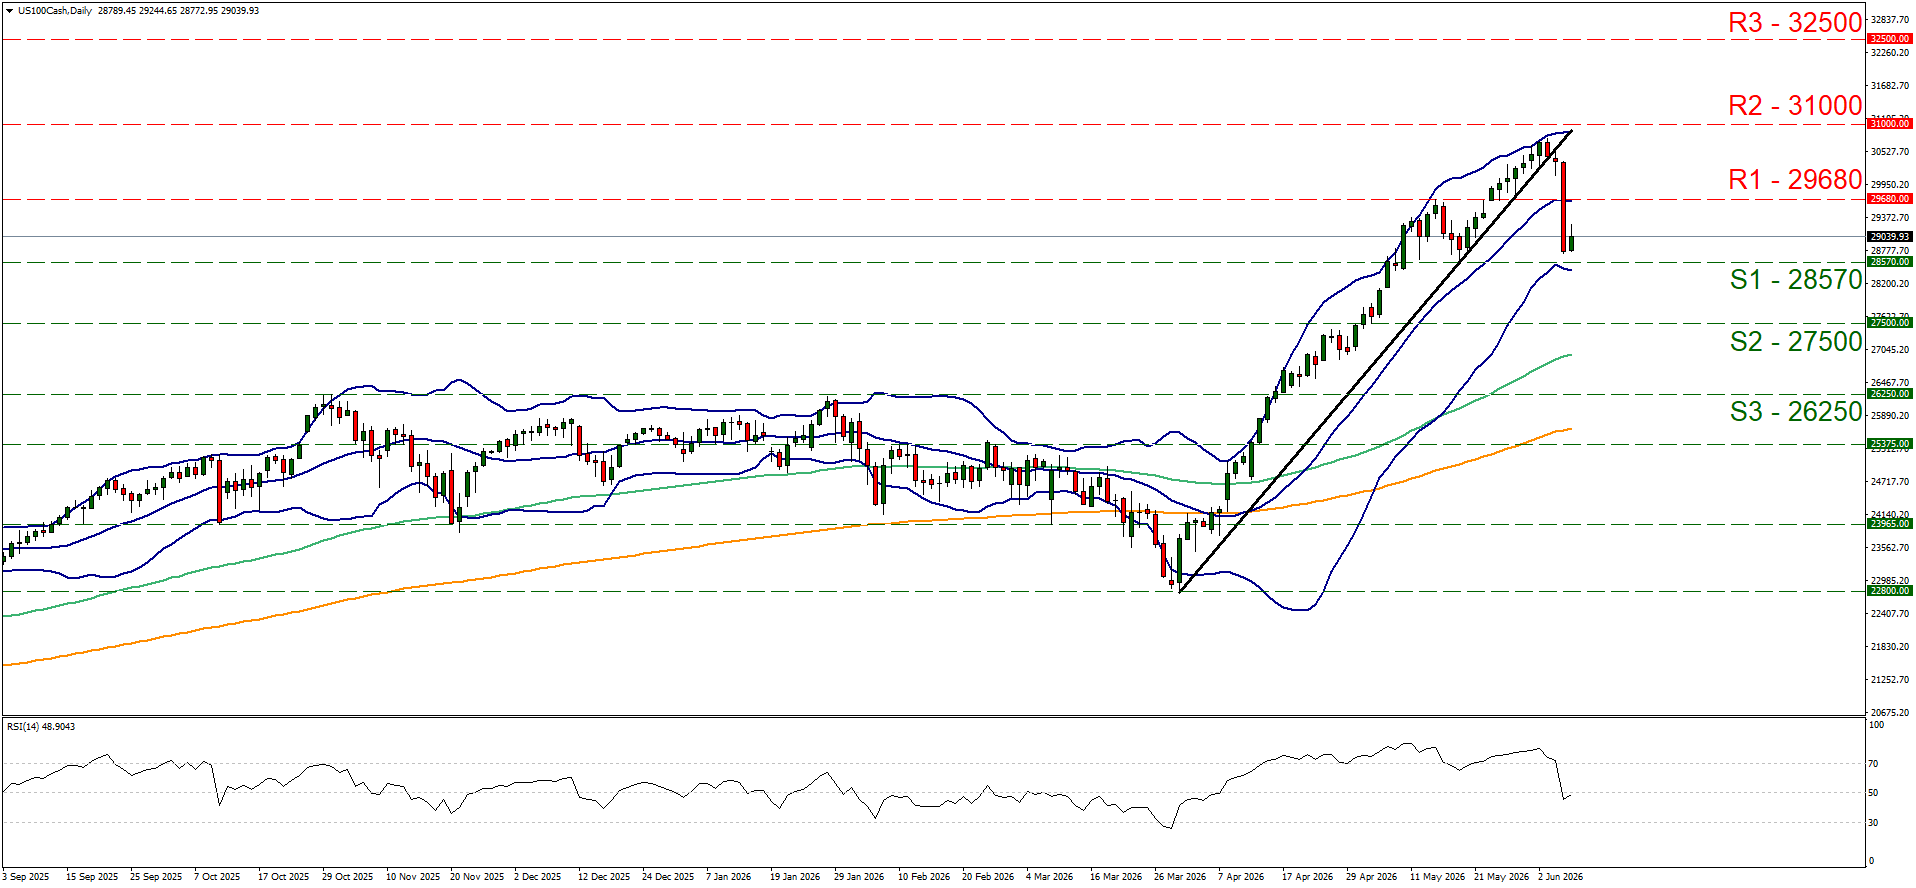
- Support: 28570 (S1), 27500 (S2), 26250 (S3)
- Resistance: 29680 (R1), 31000 (R2), 32500 (R3)
BTC/USD Daily Chart
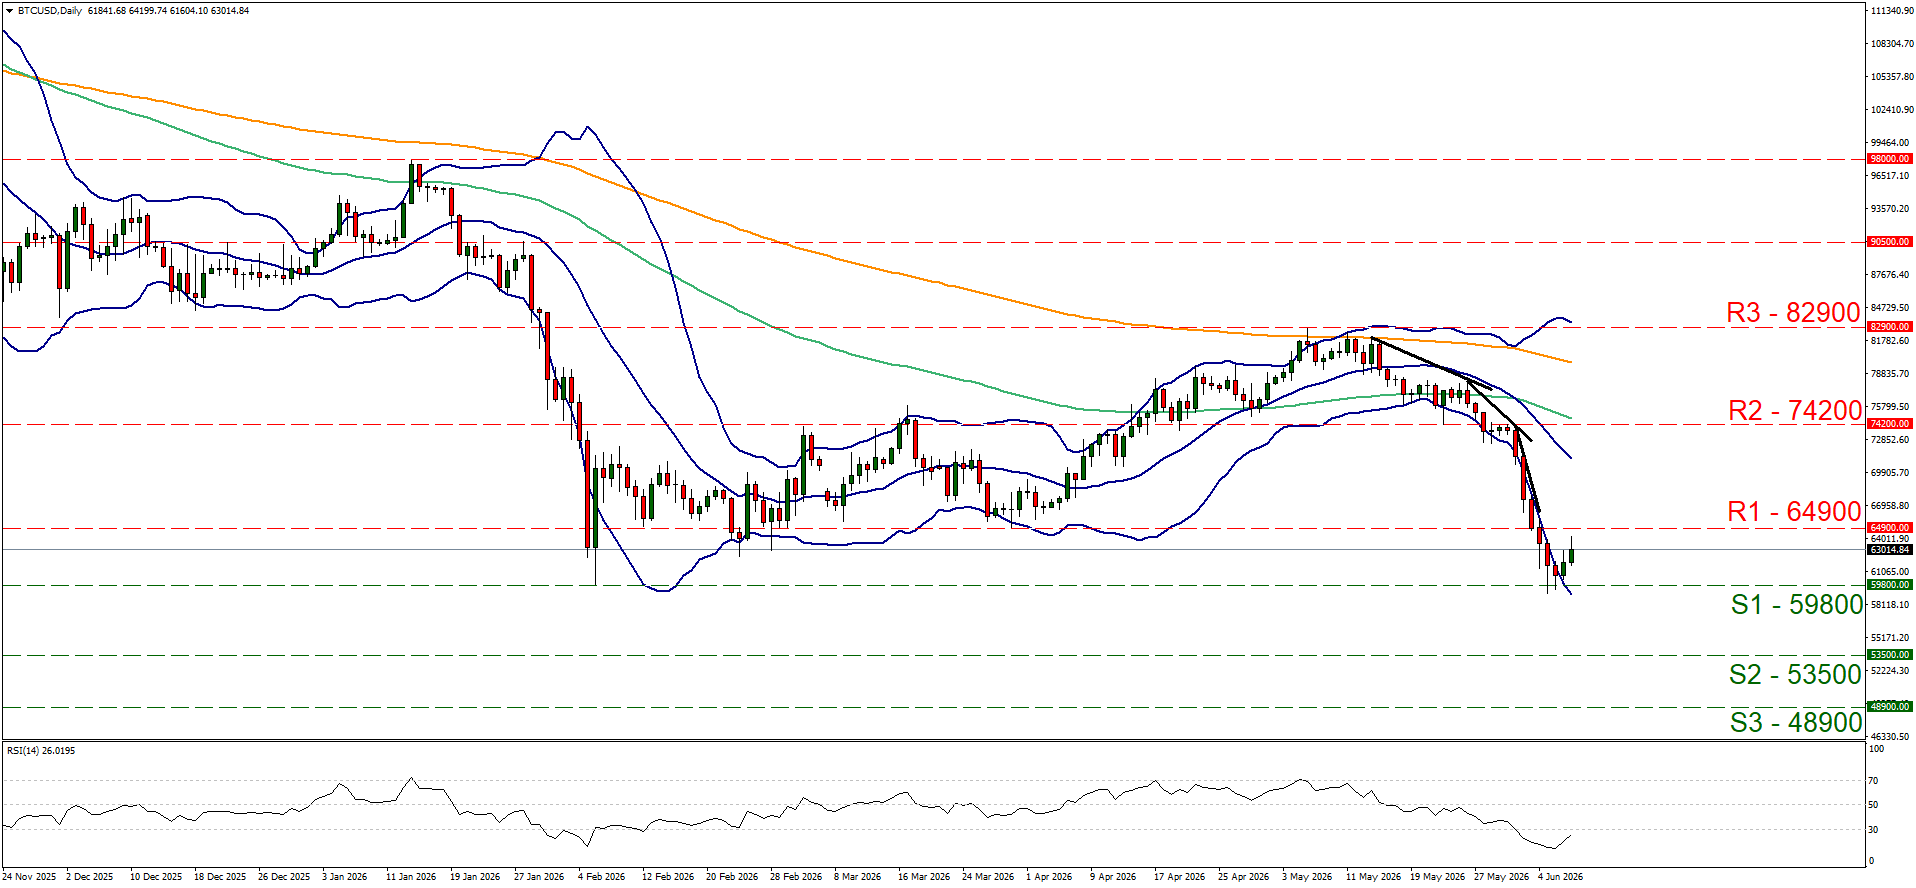
- Support: 59800 (S1), 53500 (S2), 48900 (S3)
- Resistance: 64900 (R1), 74200 (R2), 82900 (R3)
Disclaimer:
This information is not considered as investment advice or an investment recommendation, but instead a marketing communication. IronFX is not responsible for any data or information provided by third parties referenced, or hyperlinked, in this communication.